 Only
Only

OnlyMapJS
A map rendering and visualization library for web, desktop, and mobile apps. With support for popular frameworks like React, it integrates seamlessly into your existing components via a robust two-way interface for custom map behavior; overlays, charts, and finely controlled story-map animations are all first-class supported alongside 30+ data layer types. Built-in GPU acceleration also means it scales very well for both 2D and 3D use-cases. It is both human and AI agent-readable by design, and troubleshooting is effortless with a compile-time validator and runtime error debugging tools.
01 — 49 pages
Features
One concept per page. Copy it, change one attribute, see what moves.
Getting started
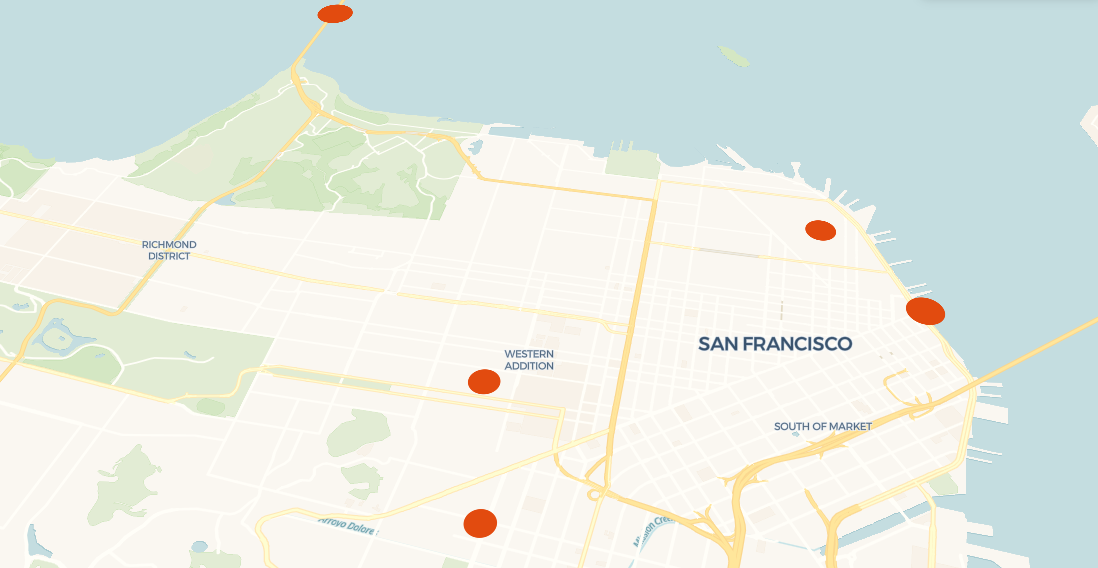
Display a map
The smallest complete OnlyMapJS page: one map element, one layer, and inline data. Set the camera with center, zoom, pitch and bearing.
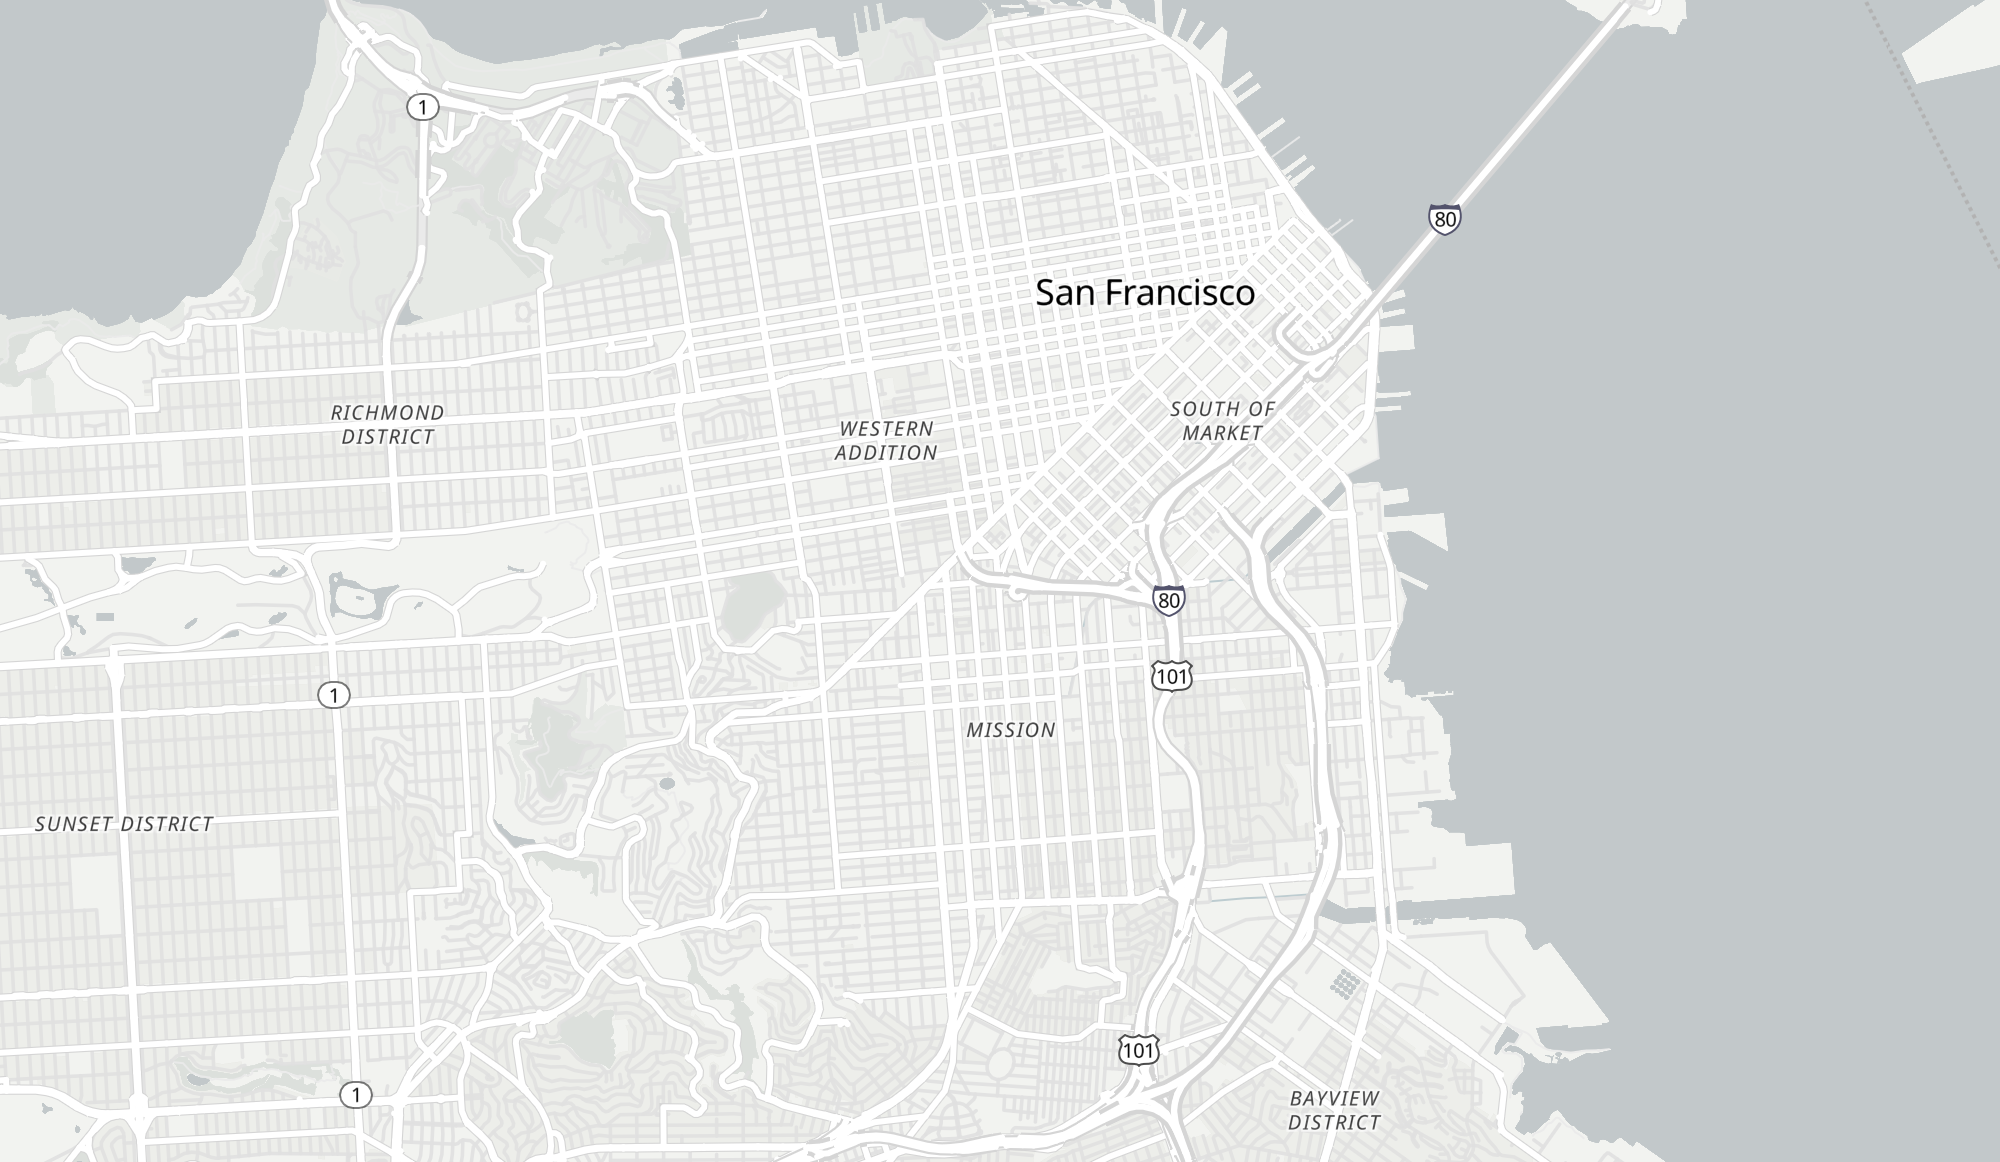
Choose a basemap
Switch between free MapLibre basemap presets while the map runs. Layers and the camera survive the change.

Build with an AI agent
Works with Claude Code, Codex, Cursor or any agent: use Copy for Your Agent on any example, then chat to build your own customized map.
Layers
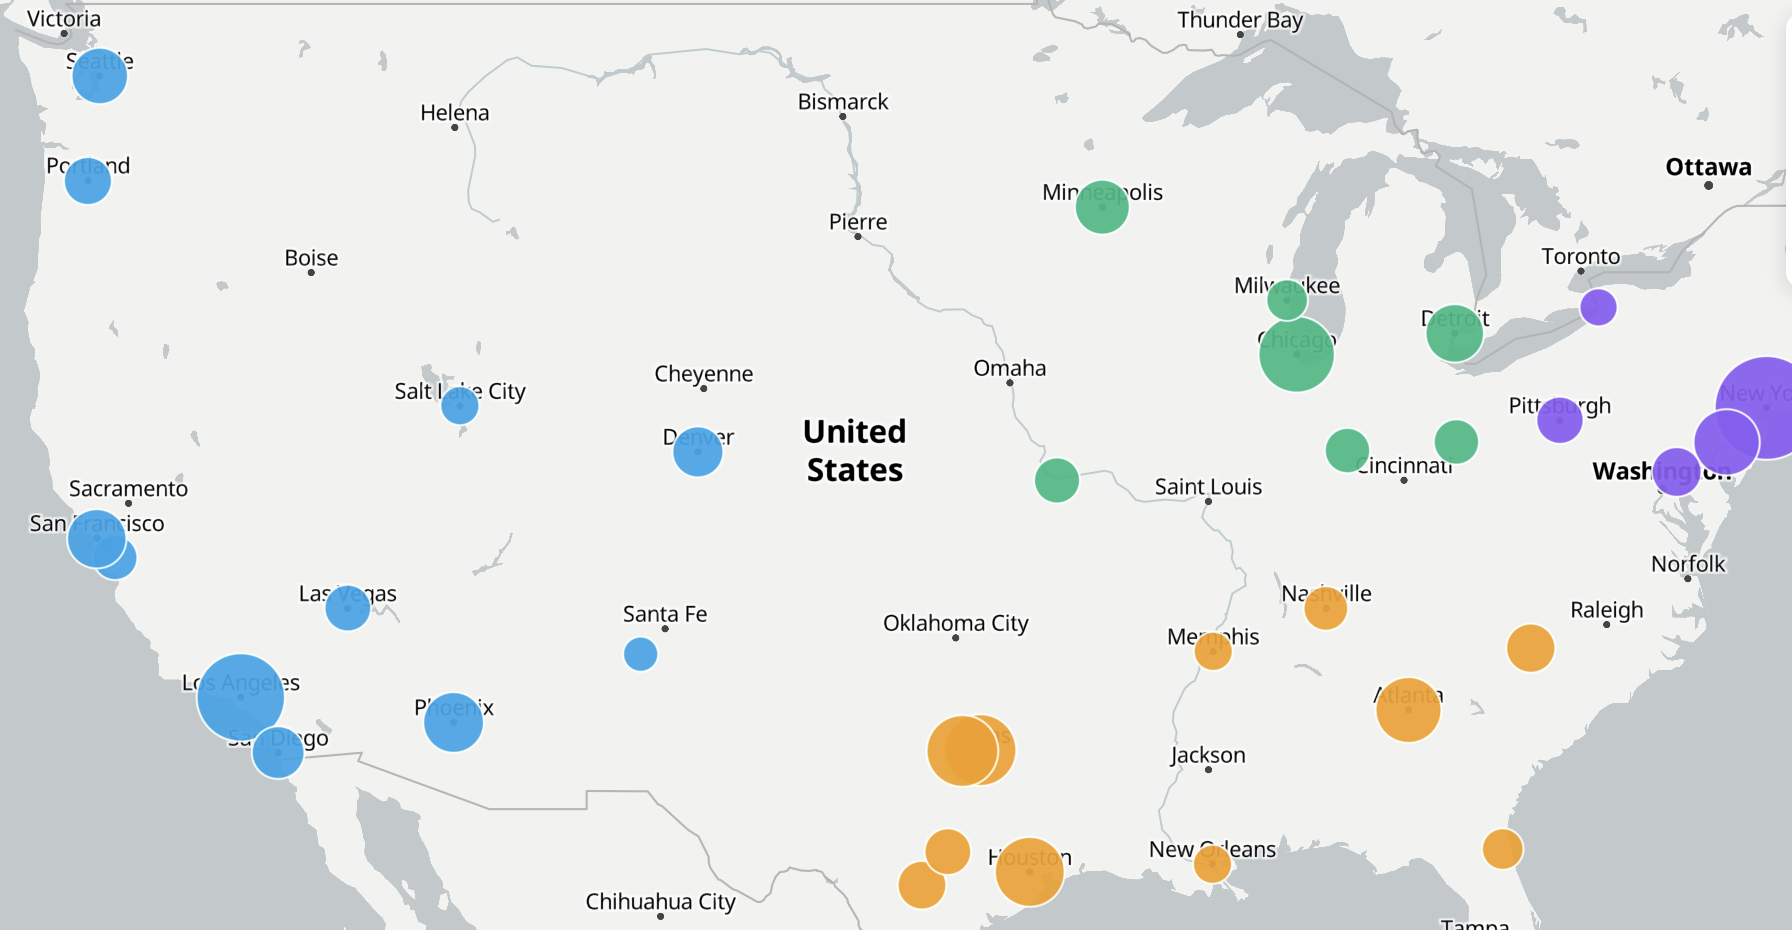
Add scatterplot points
ScatterplotLayer points from a JSON file, sized by population with a sqrt scale and coloured by category.
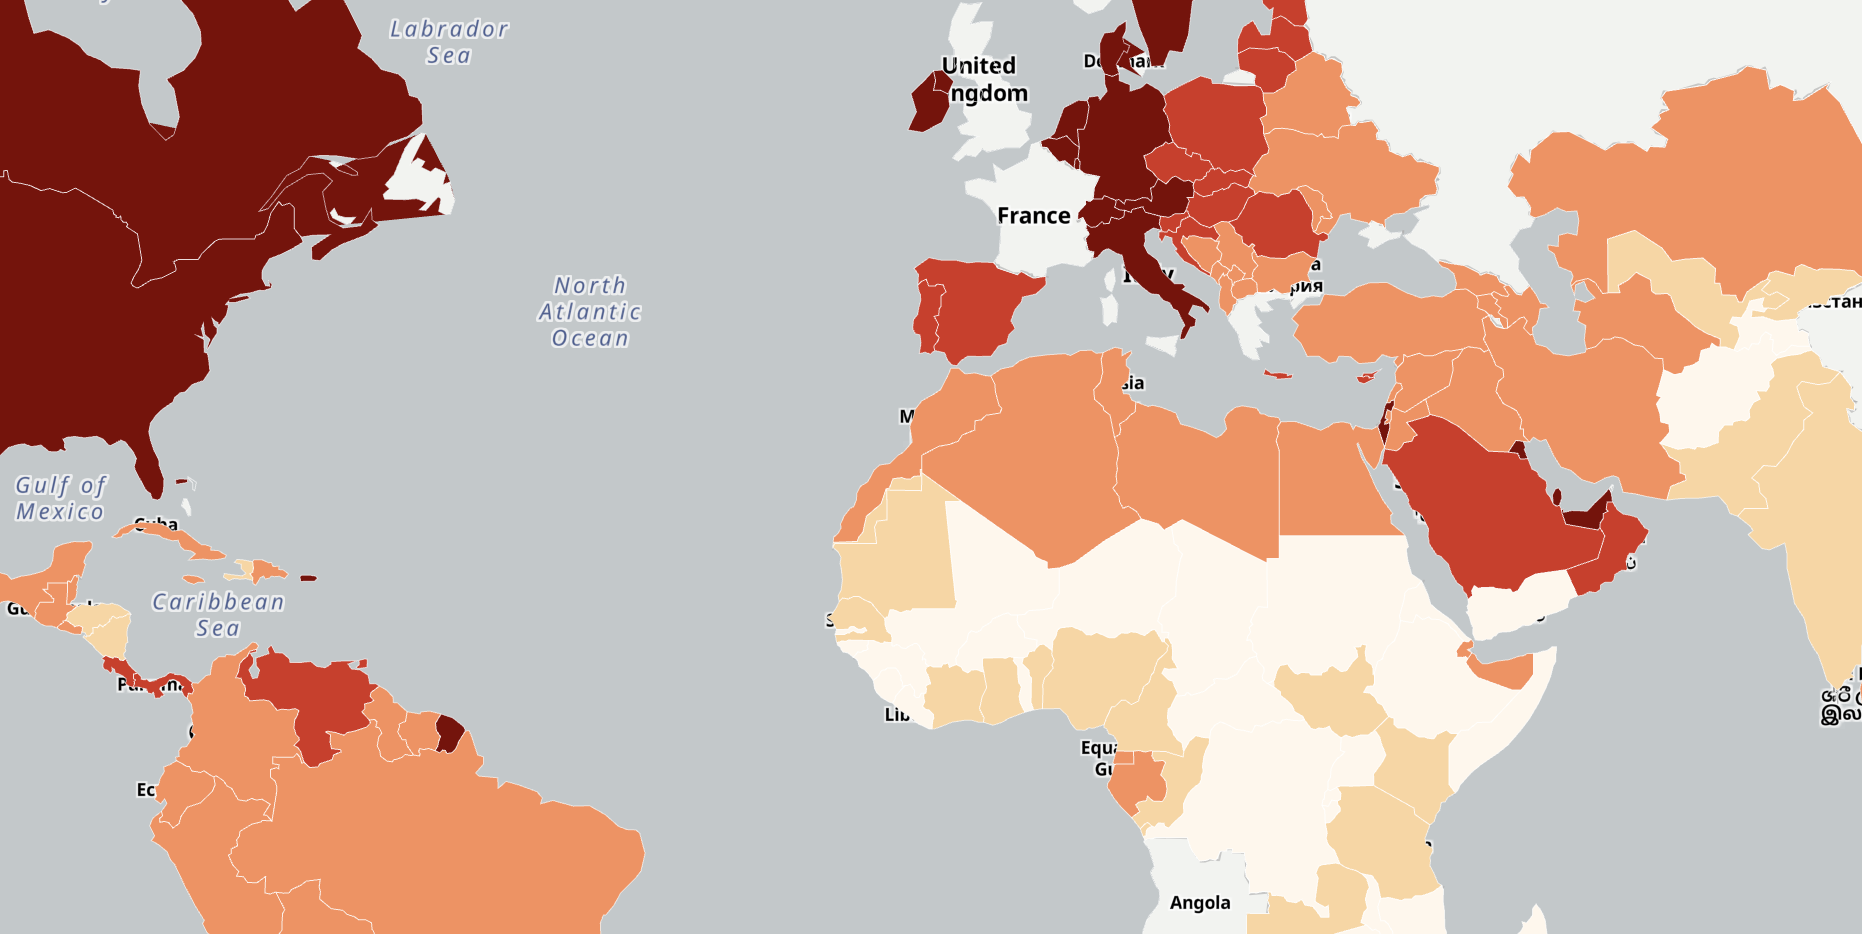
Create a choropleth
Shade real country boundaries by GDP per capita with GeoJsonLayer. A threshold scale labels the legend classes.
Draw arcs and paths
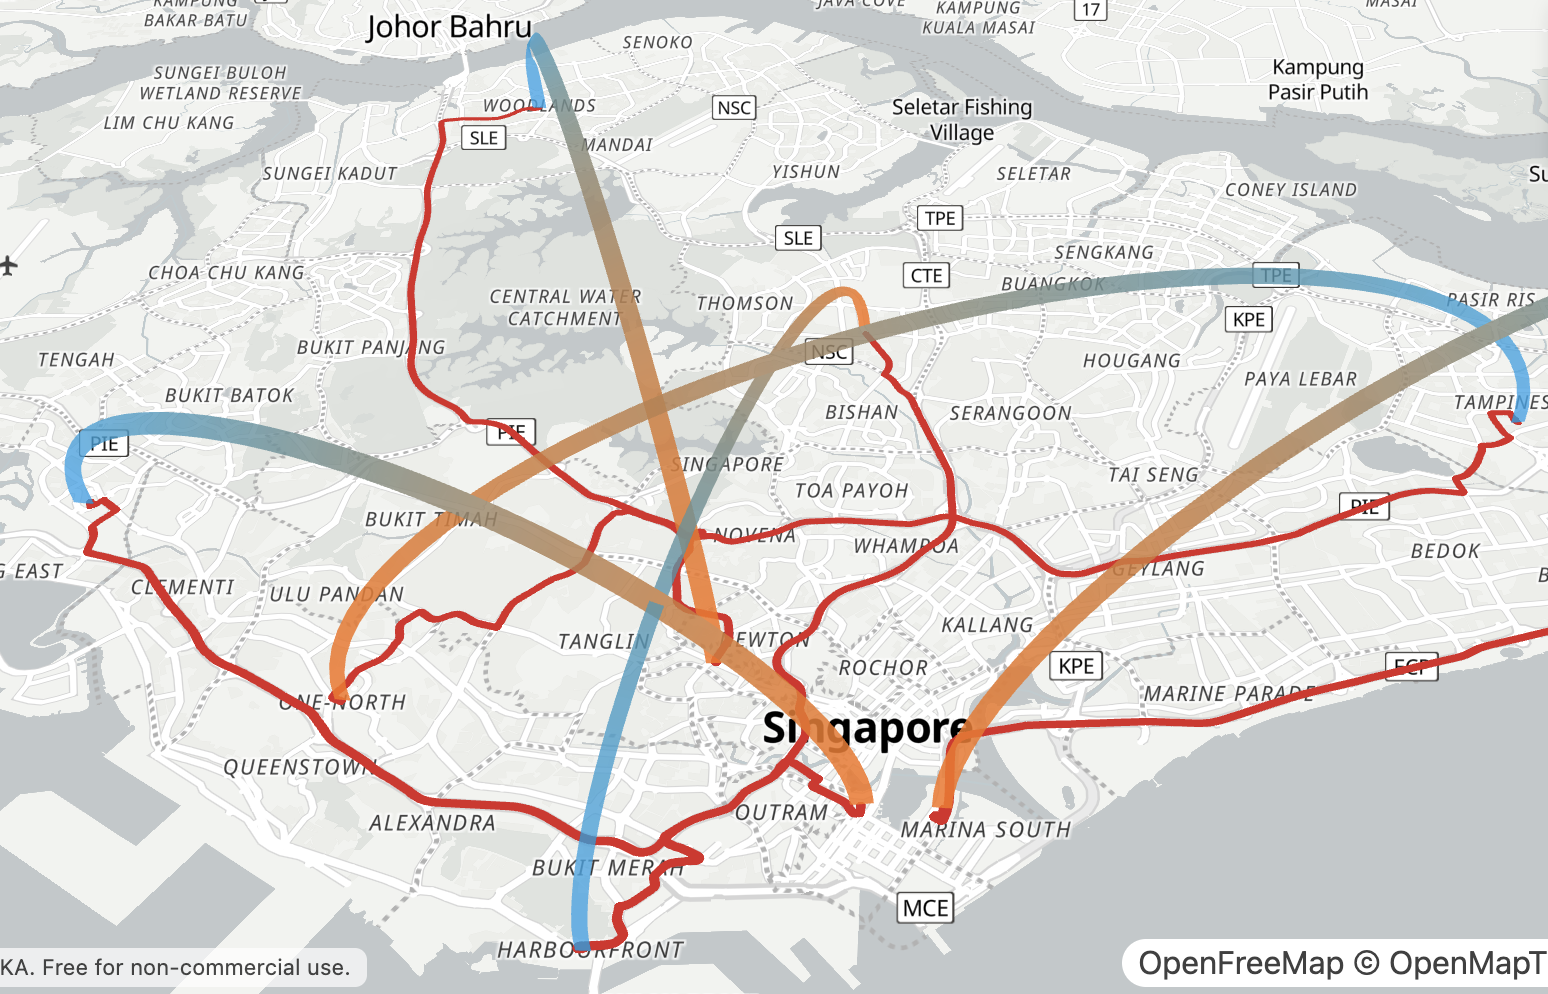
The same five journeys twice: PathLayer follows the real driving route, ArcLayer curves straight between endpoints.
Animate trips

Move 48 vehicles at once with TripsLayer. Each carries its own departure time, so traffic builds and thins on its own.
Create a heatmap
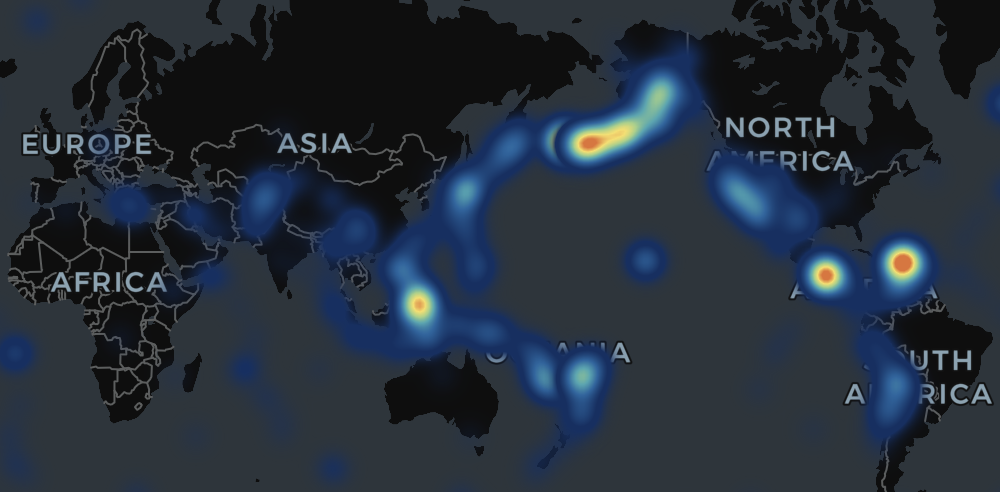
HeatmapLayer turns thousands of points into a density surface, weighted so large events outweigh clusters of small ones.
Bin points into hexagons
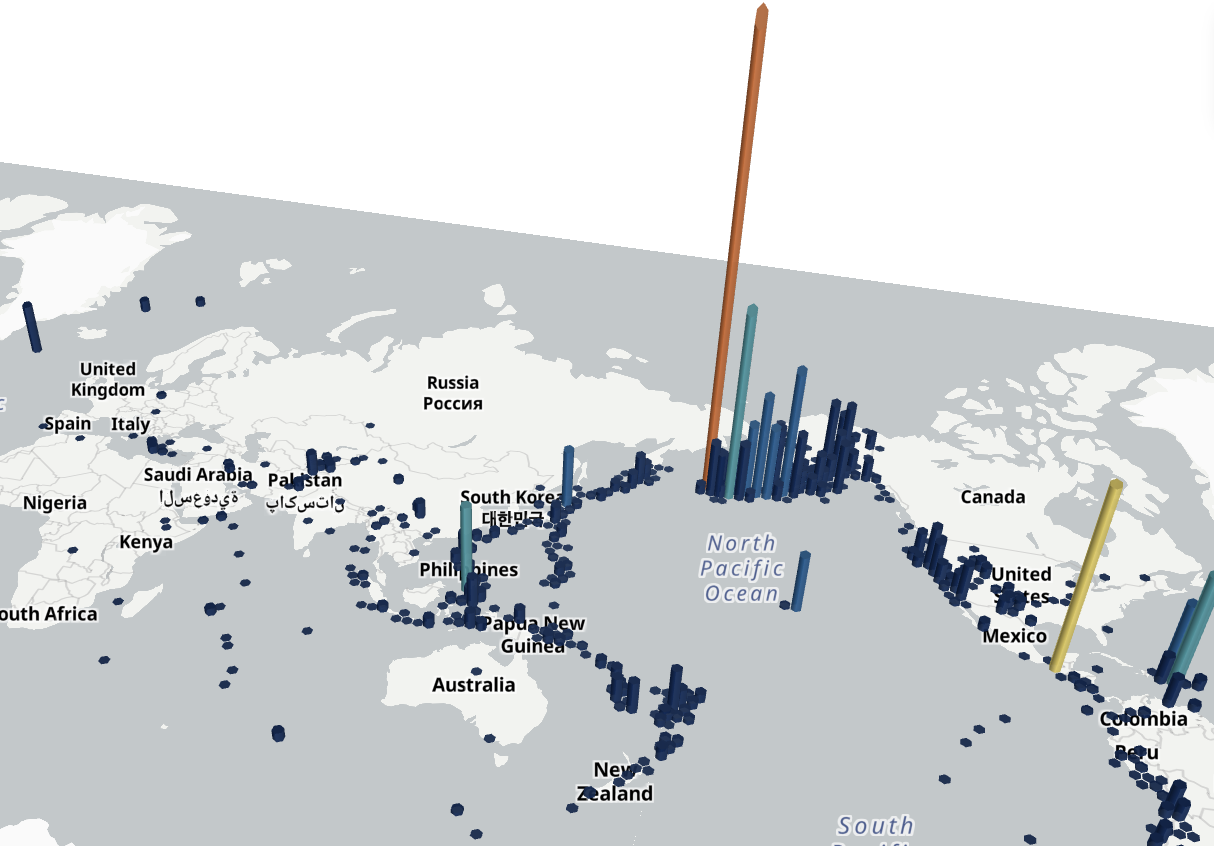
HexagonLayer bins points into counts you can pick, with the tally encoded as both colour and height.
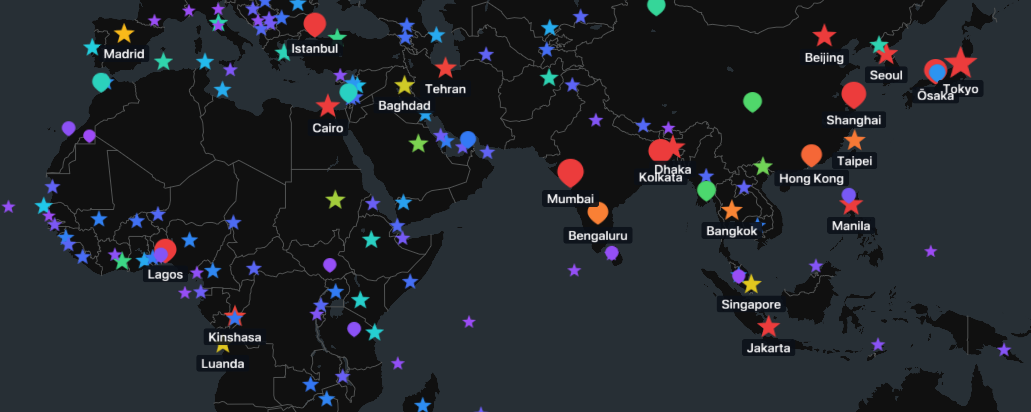
Add icons and labels
Mark places with IconLayer sprites cut from one atlas, then name them with TextLayer. A filter keeps only the biggest cities labelled.
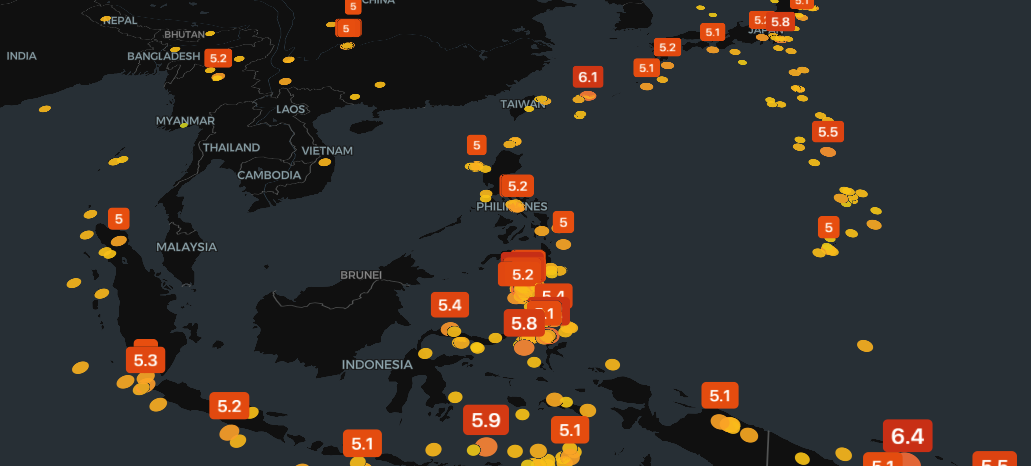
Label many features
PopupLayer draws a WebGL badge on every earthquake above magnitude 5, over a heat ramp of all 1,960 on a dark map.
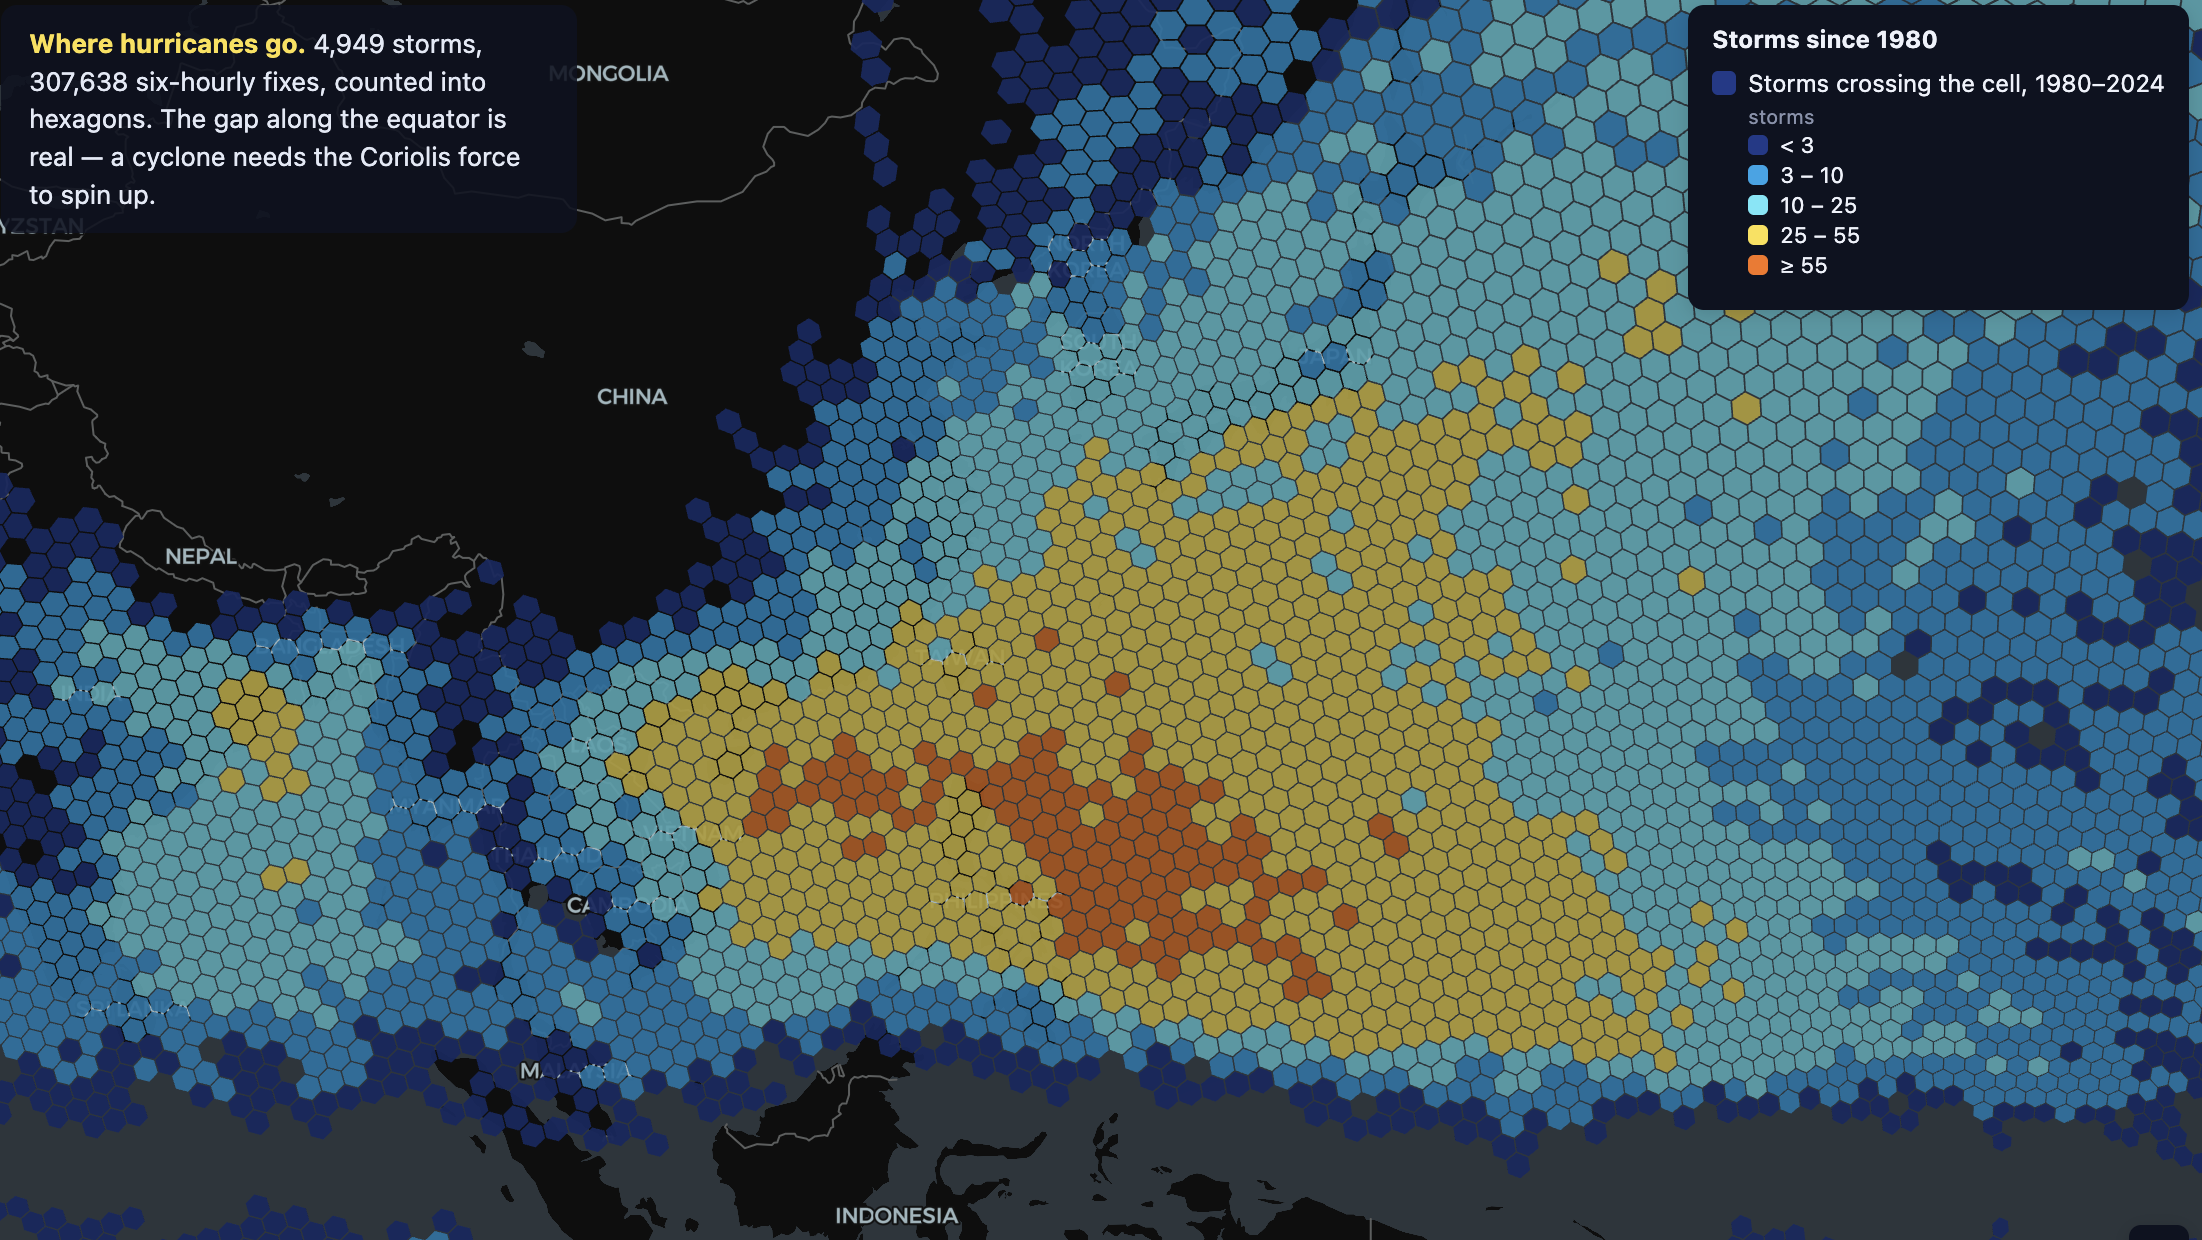
Aggregate by H3 cells
H3HexagonLayer draws pre-binned data from a column of H3 cell ids: 45 years of cyclone tracks. H3ClusterLayer merges cells into outlines.
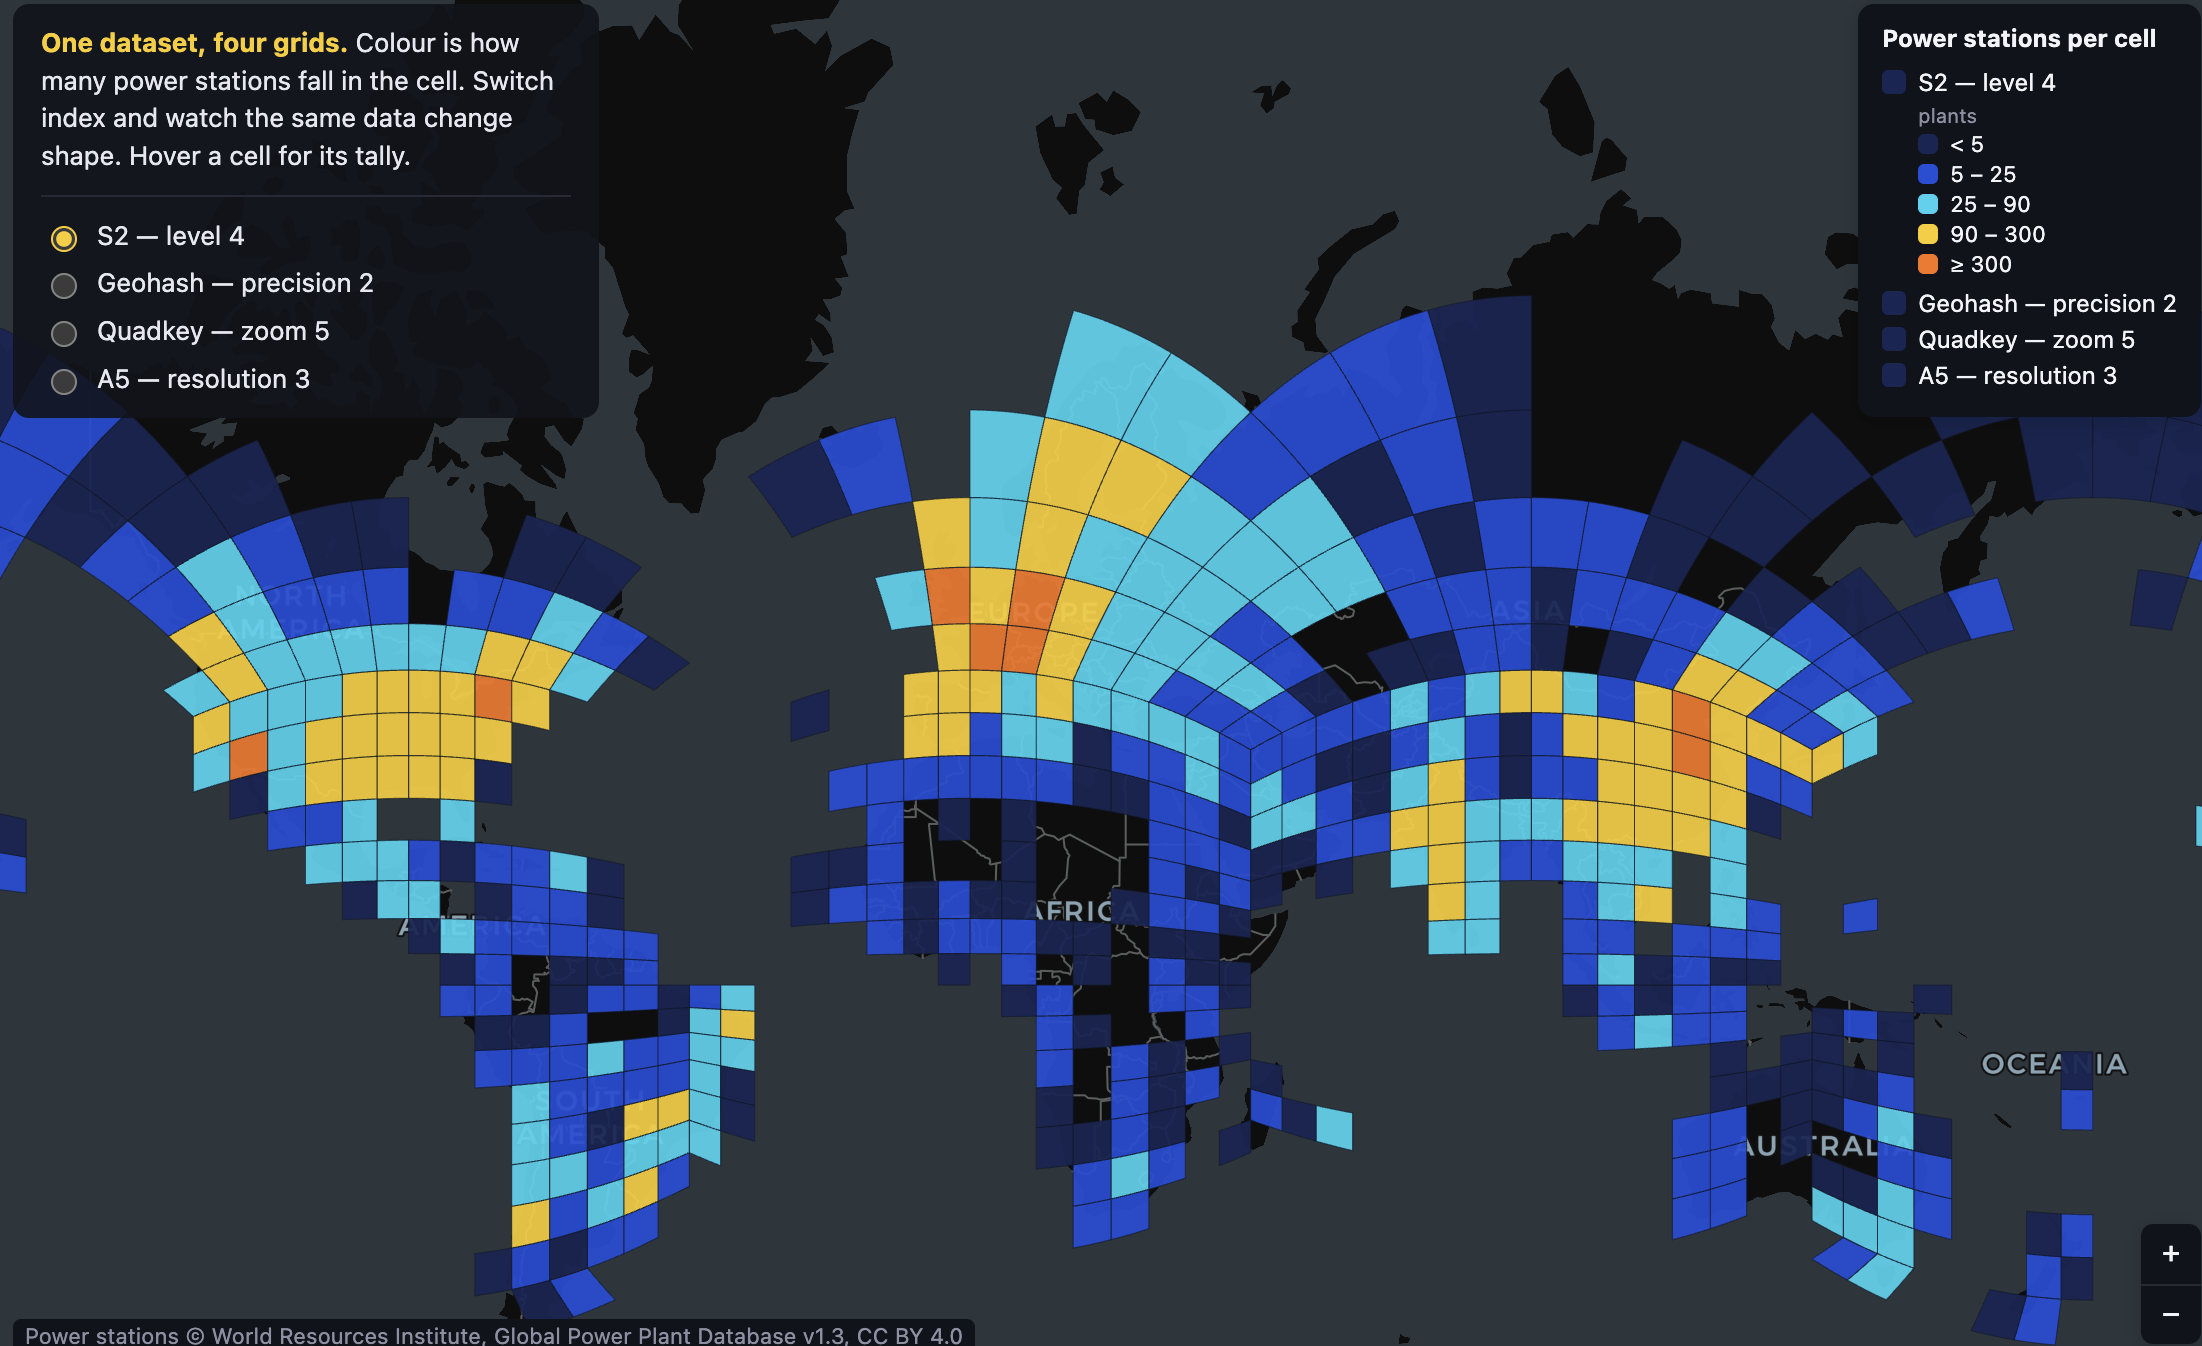
Draw spatial index cells
S2Layer, GeohashLayer, QuadkeyLayer and A5Layer draw spatial index cells from a column of ids. The same power stations, binned four ways.
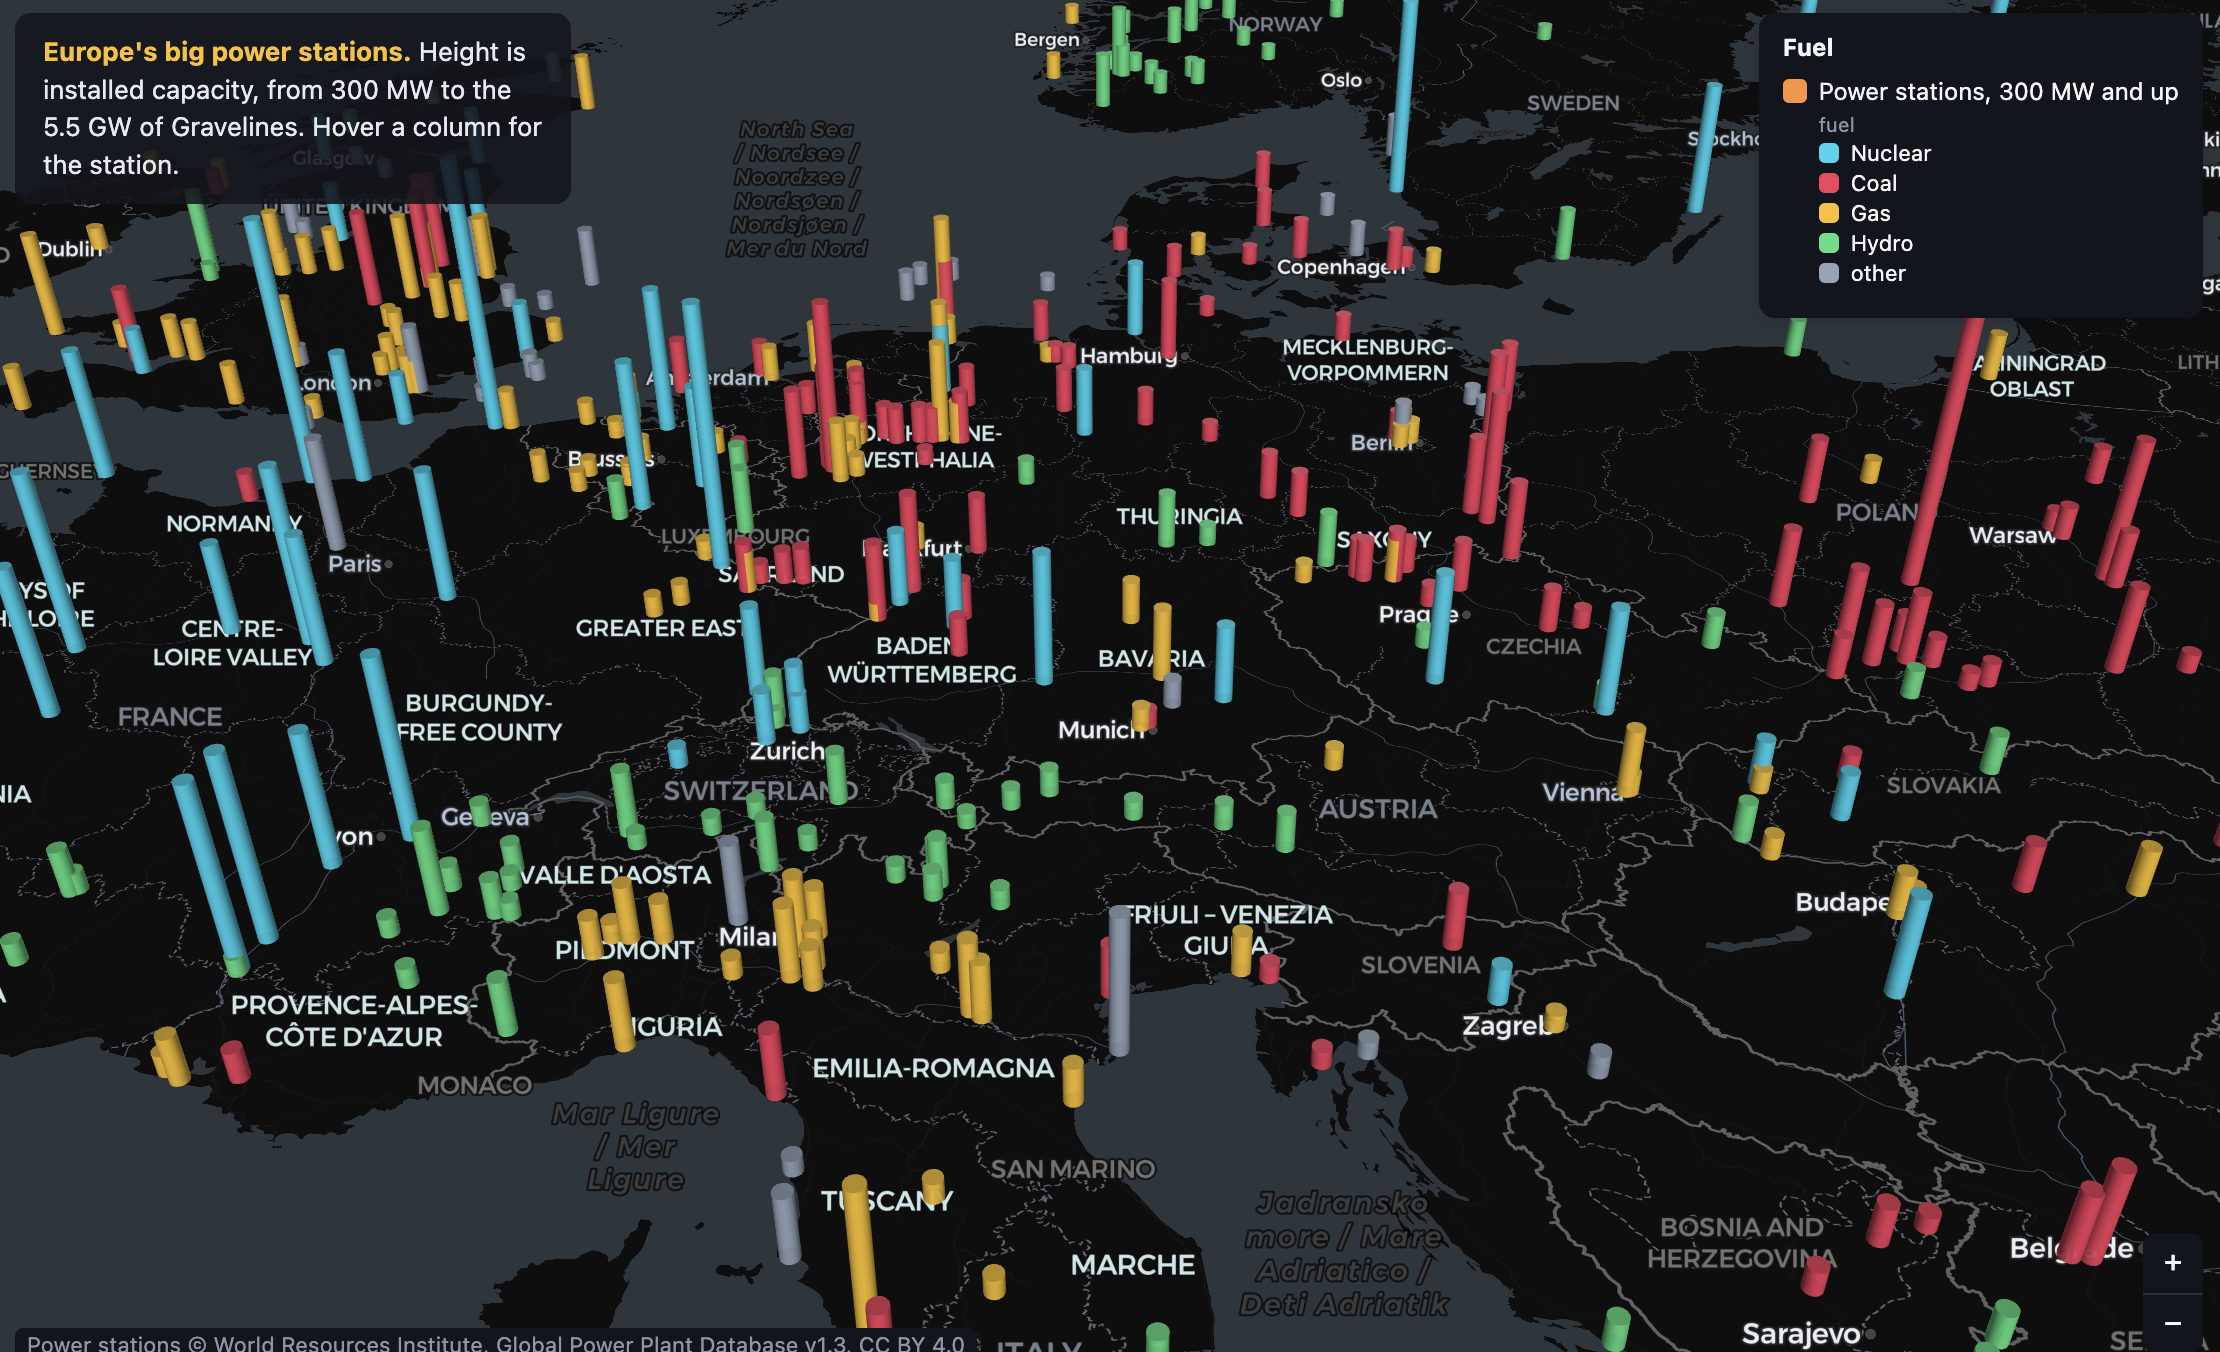
Draw 3D columns
Stand a ColumnLayer bar on every power station, sized by capacity and coloured by fuel. GridCellLayer is the square-cell sibling.
Rasters & tiles
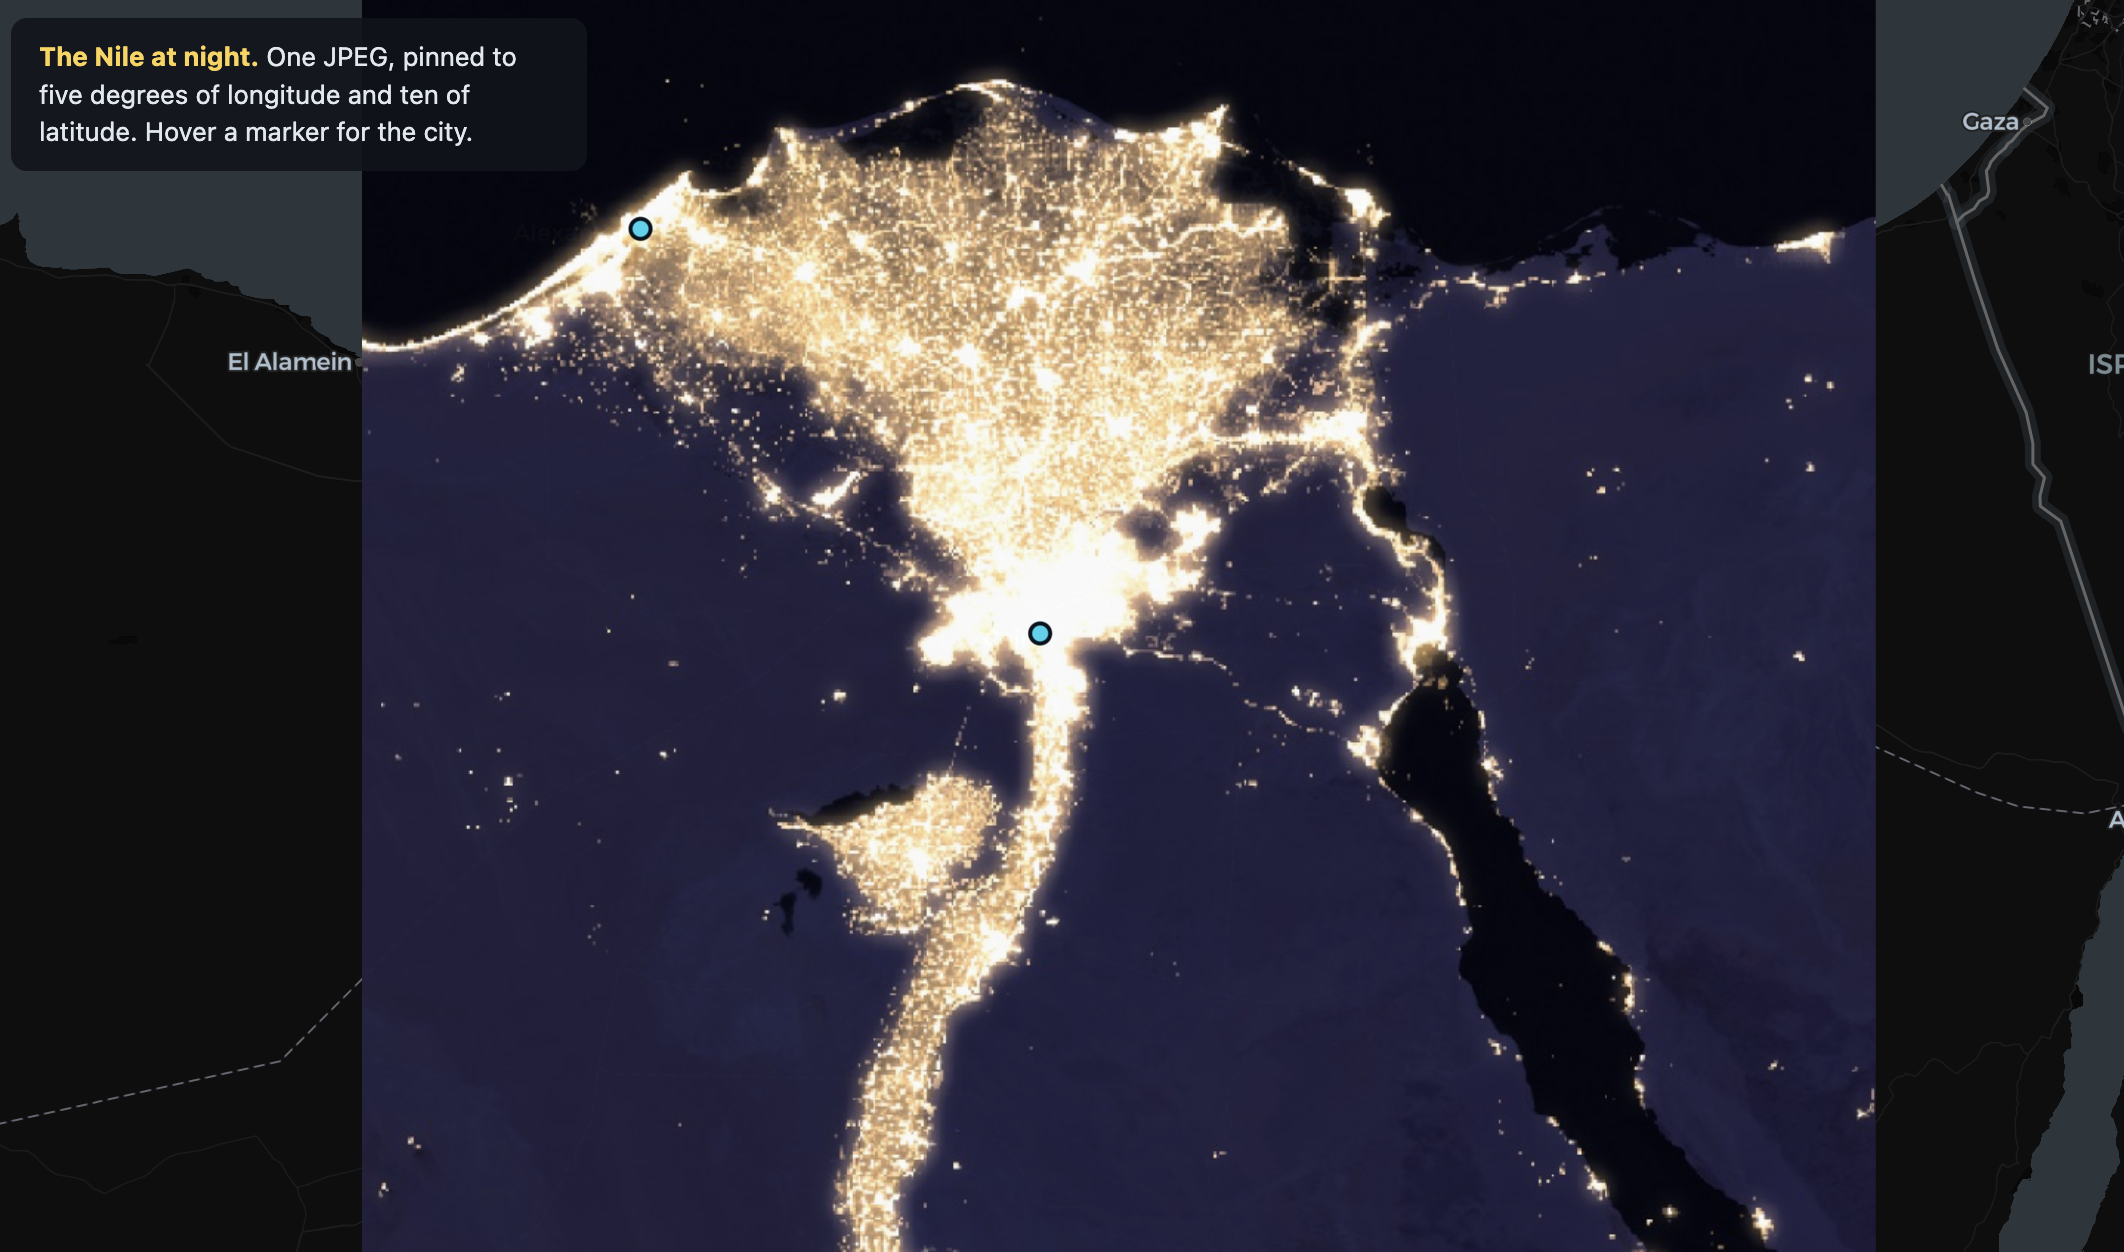
Overlay an image
Pin one georeferenced picture to the map with BitmapLayer: an image and a bounds box, no data rows at all.
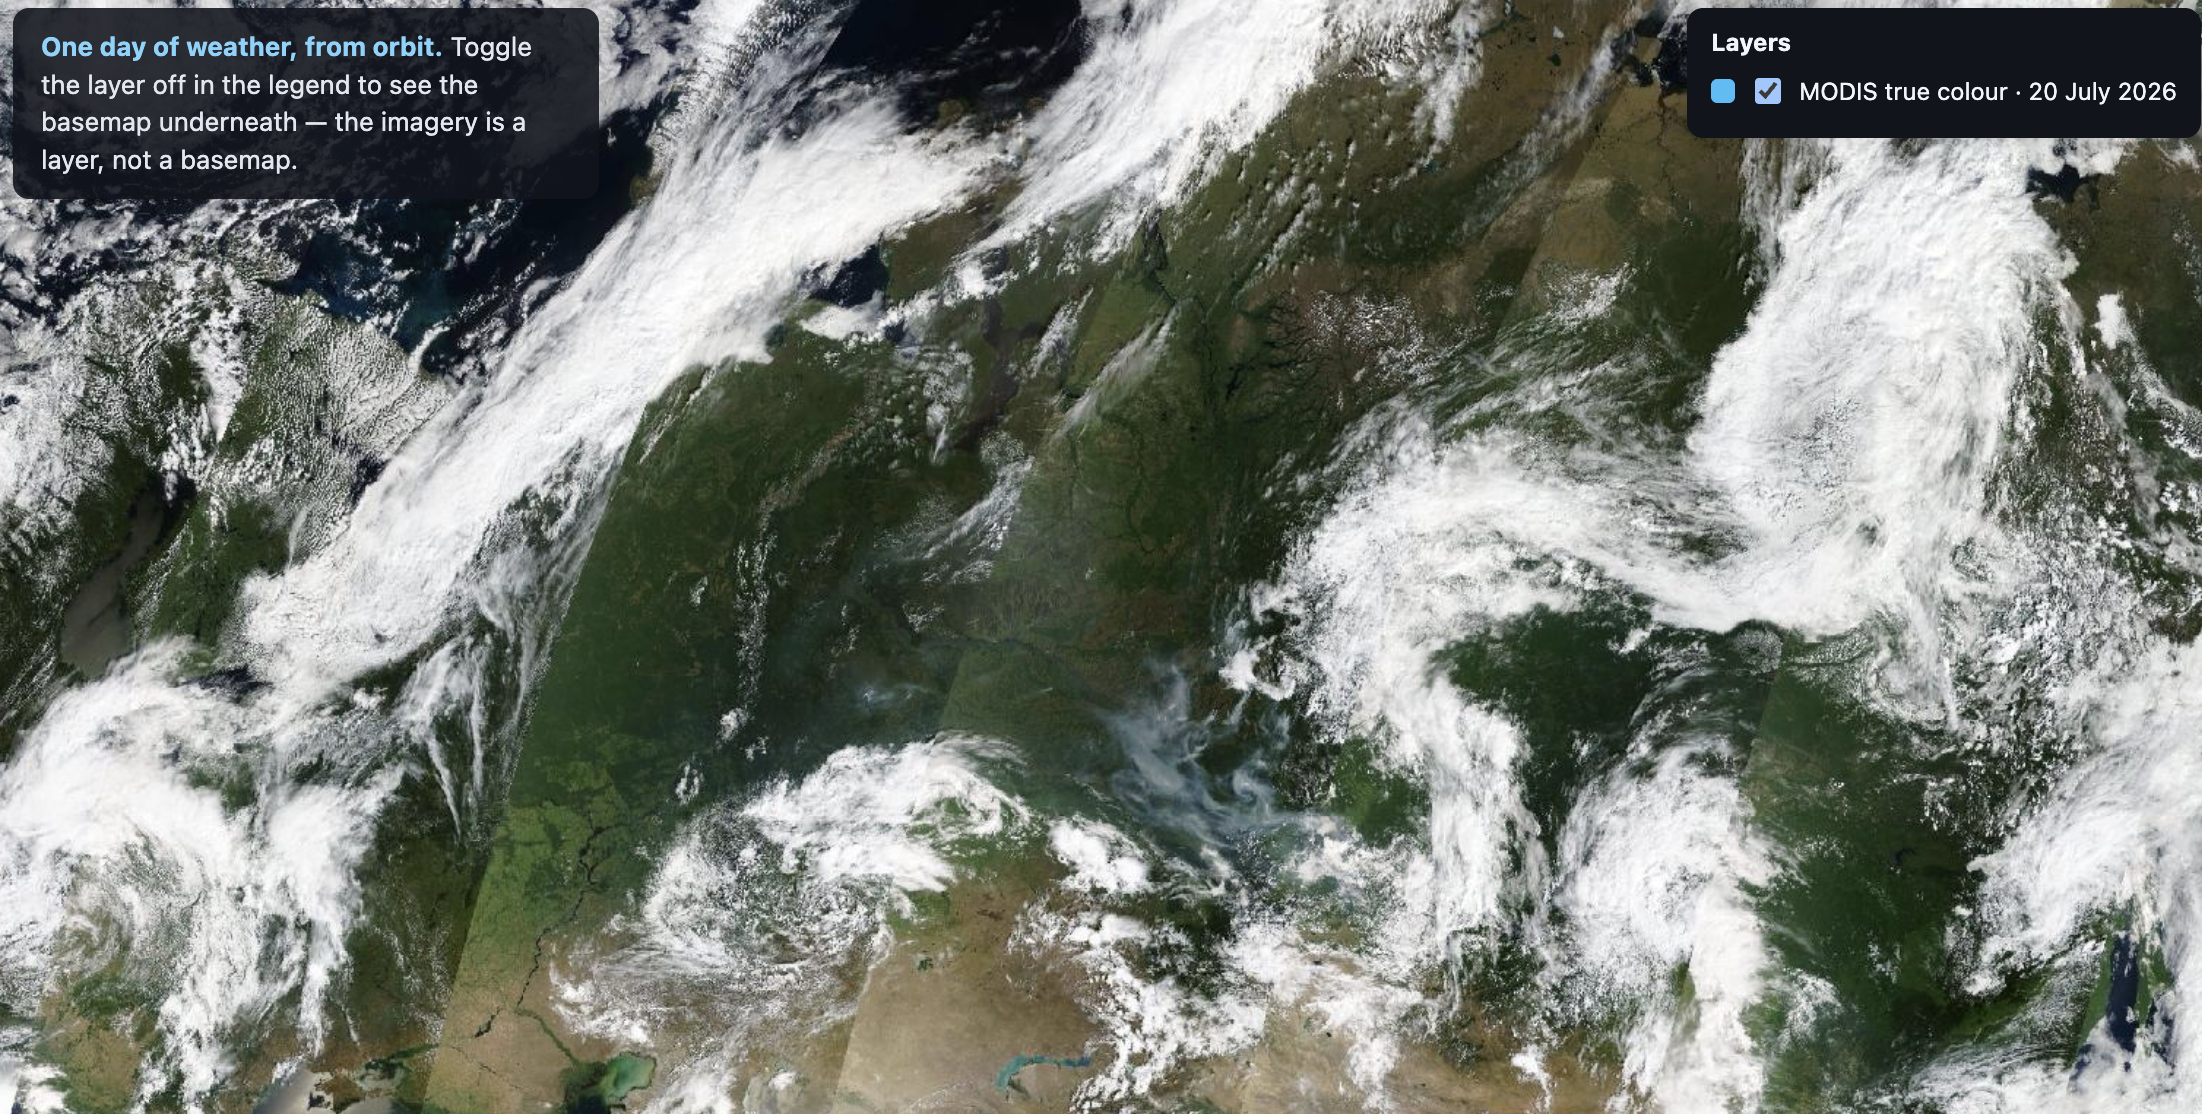
Add a raster tile layer
TileLayer takes a {z}/{x}/{y} URL template and draws NASA satellite imagery as a layer you can toggle, fade and stack.
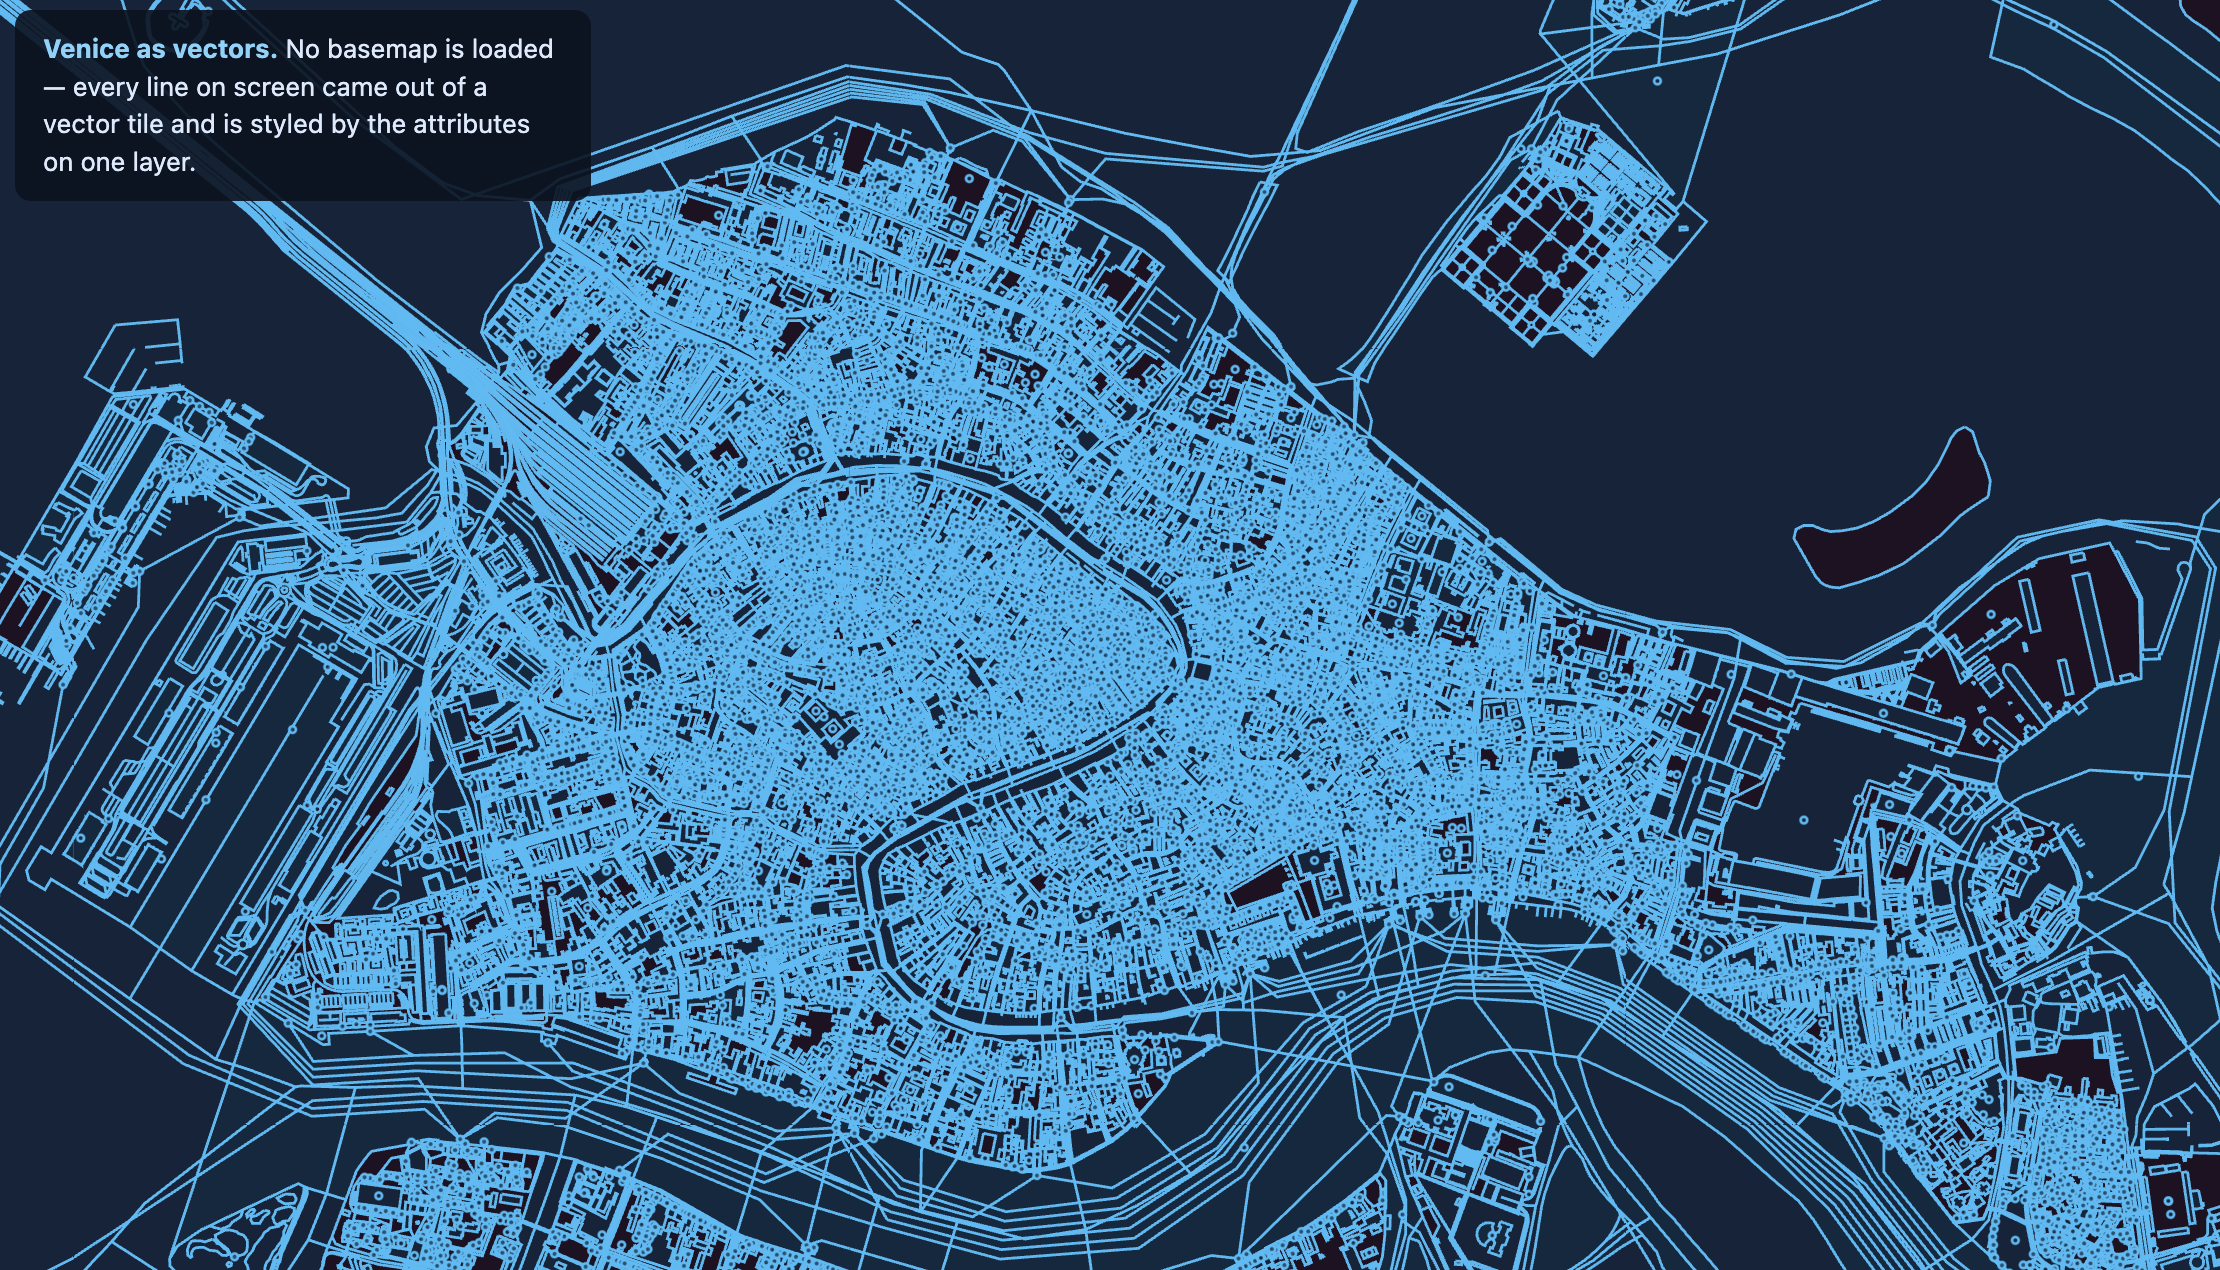
Add vector tiles
MVTLayer turns vector tiles into real geometry styled by your own accessors: OpenStreetMap over Venice, with no basemap at all.
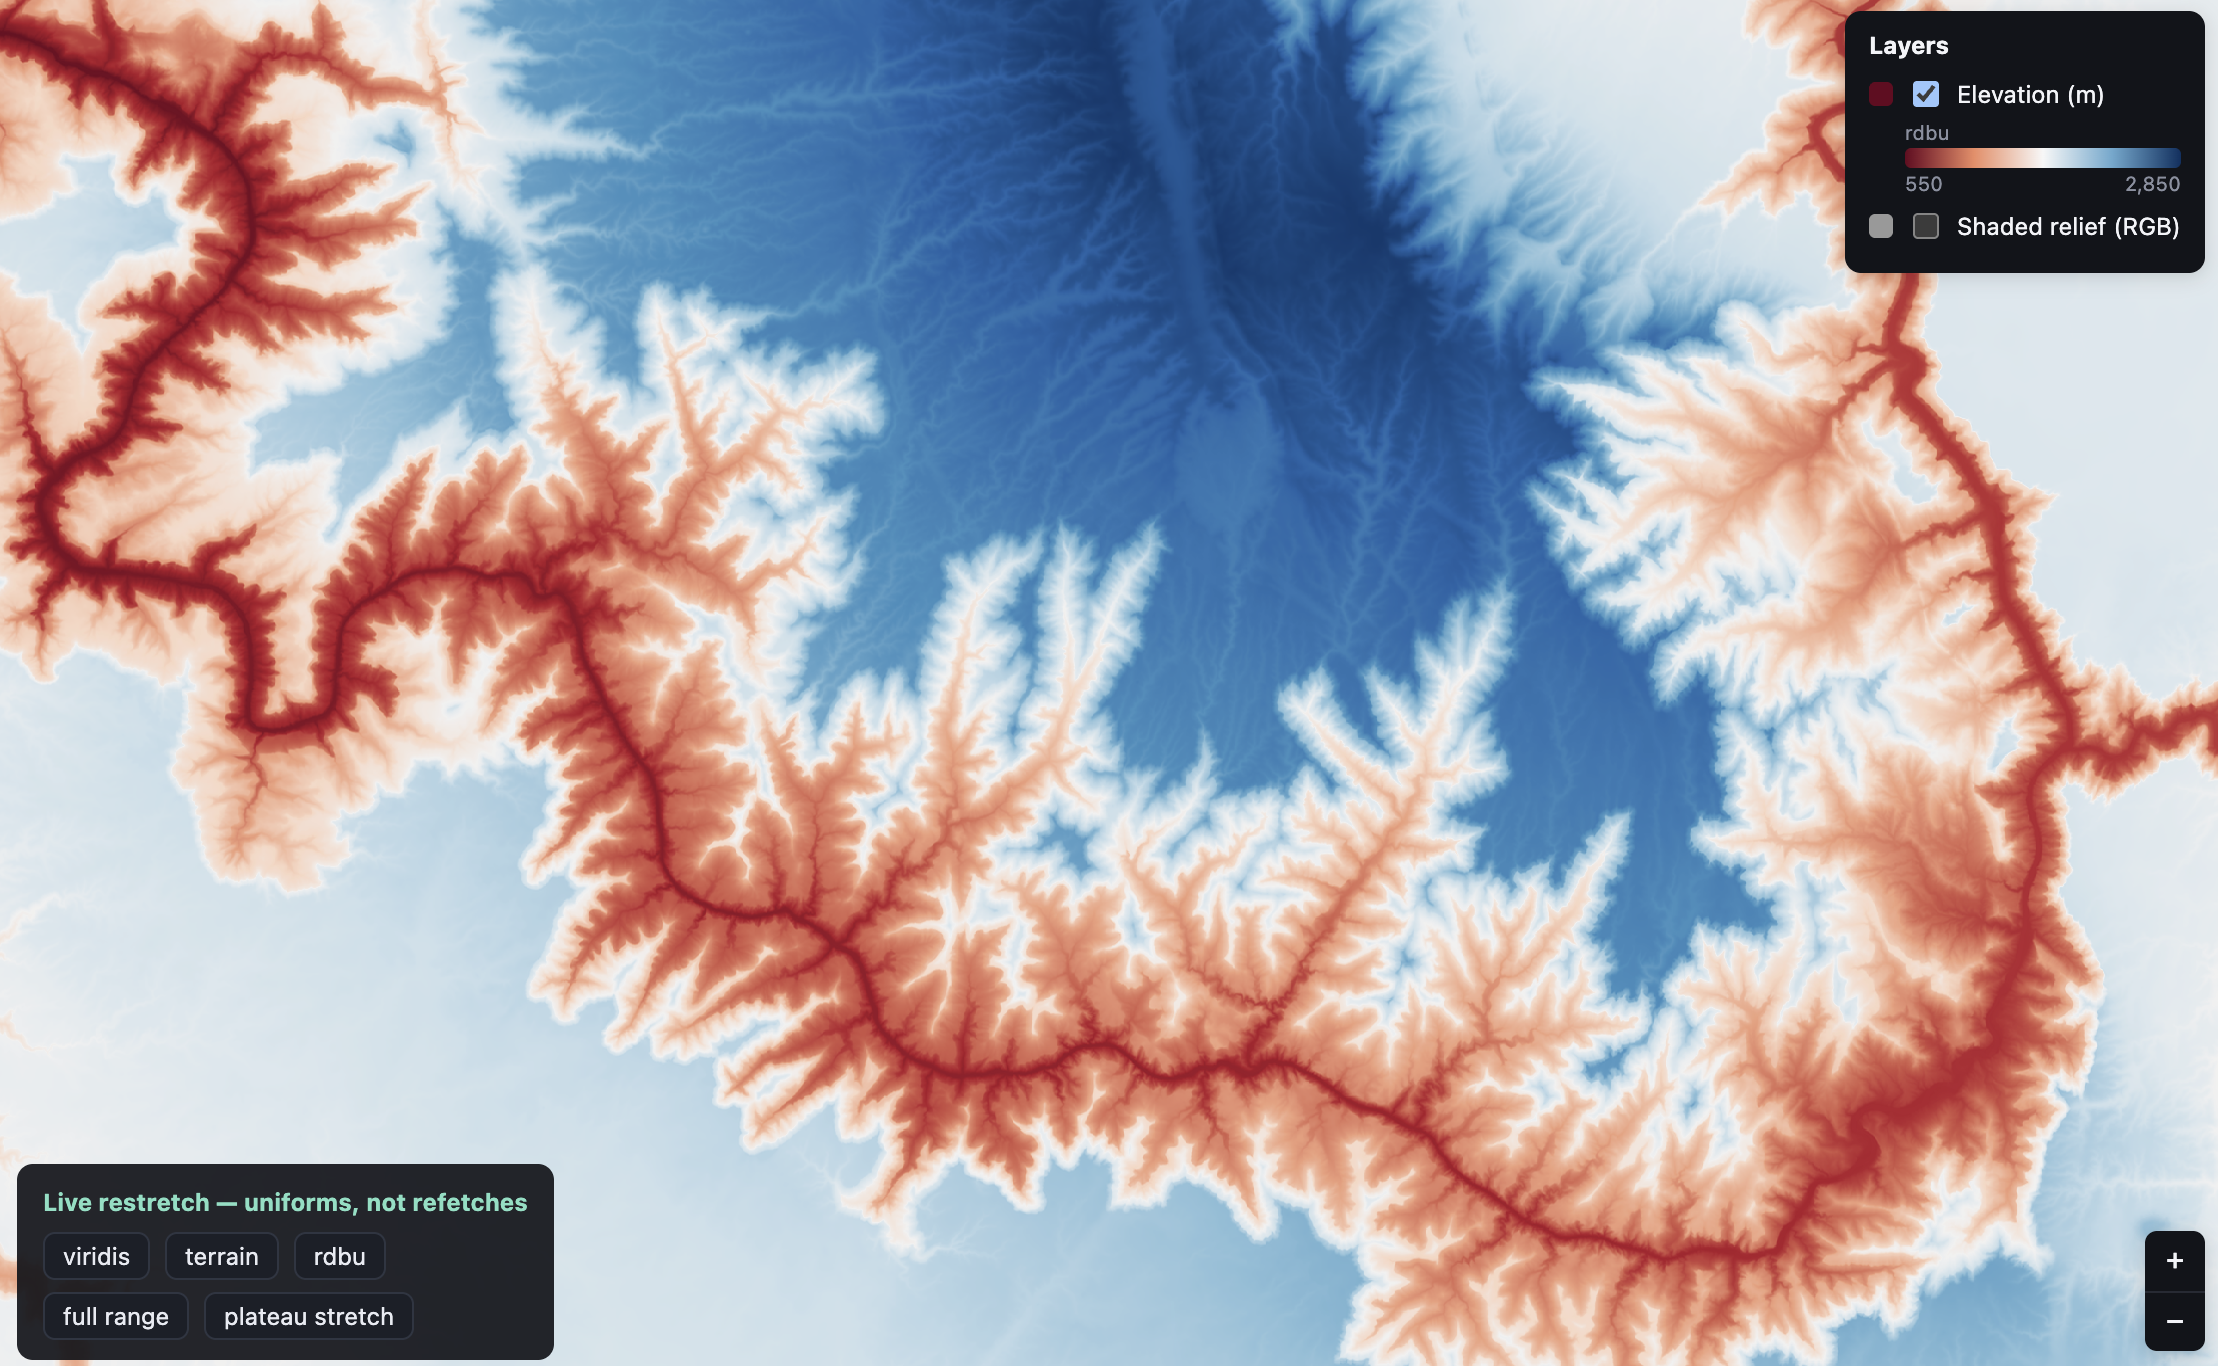
Display a GeoTIFF
COGLayer streams a Cloud-Optimized GeoTIFF by HTTP range request. Recolour and restretch Grand Canyon elevation as GPU uniforms.
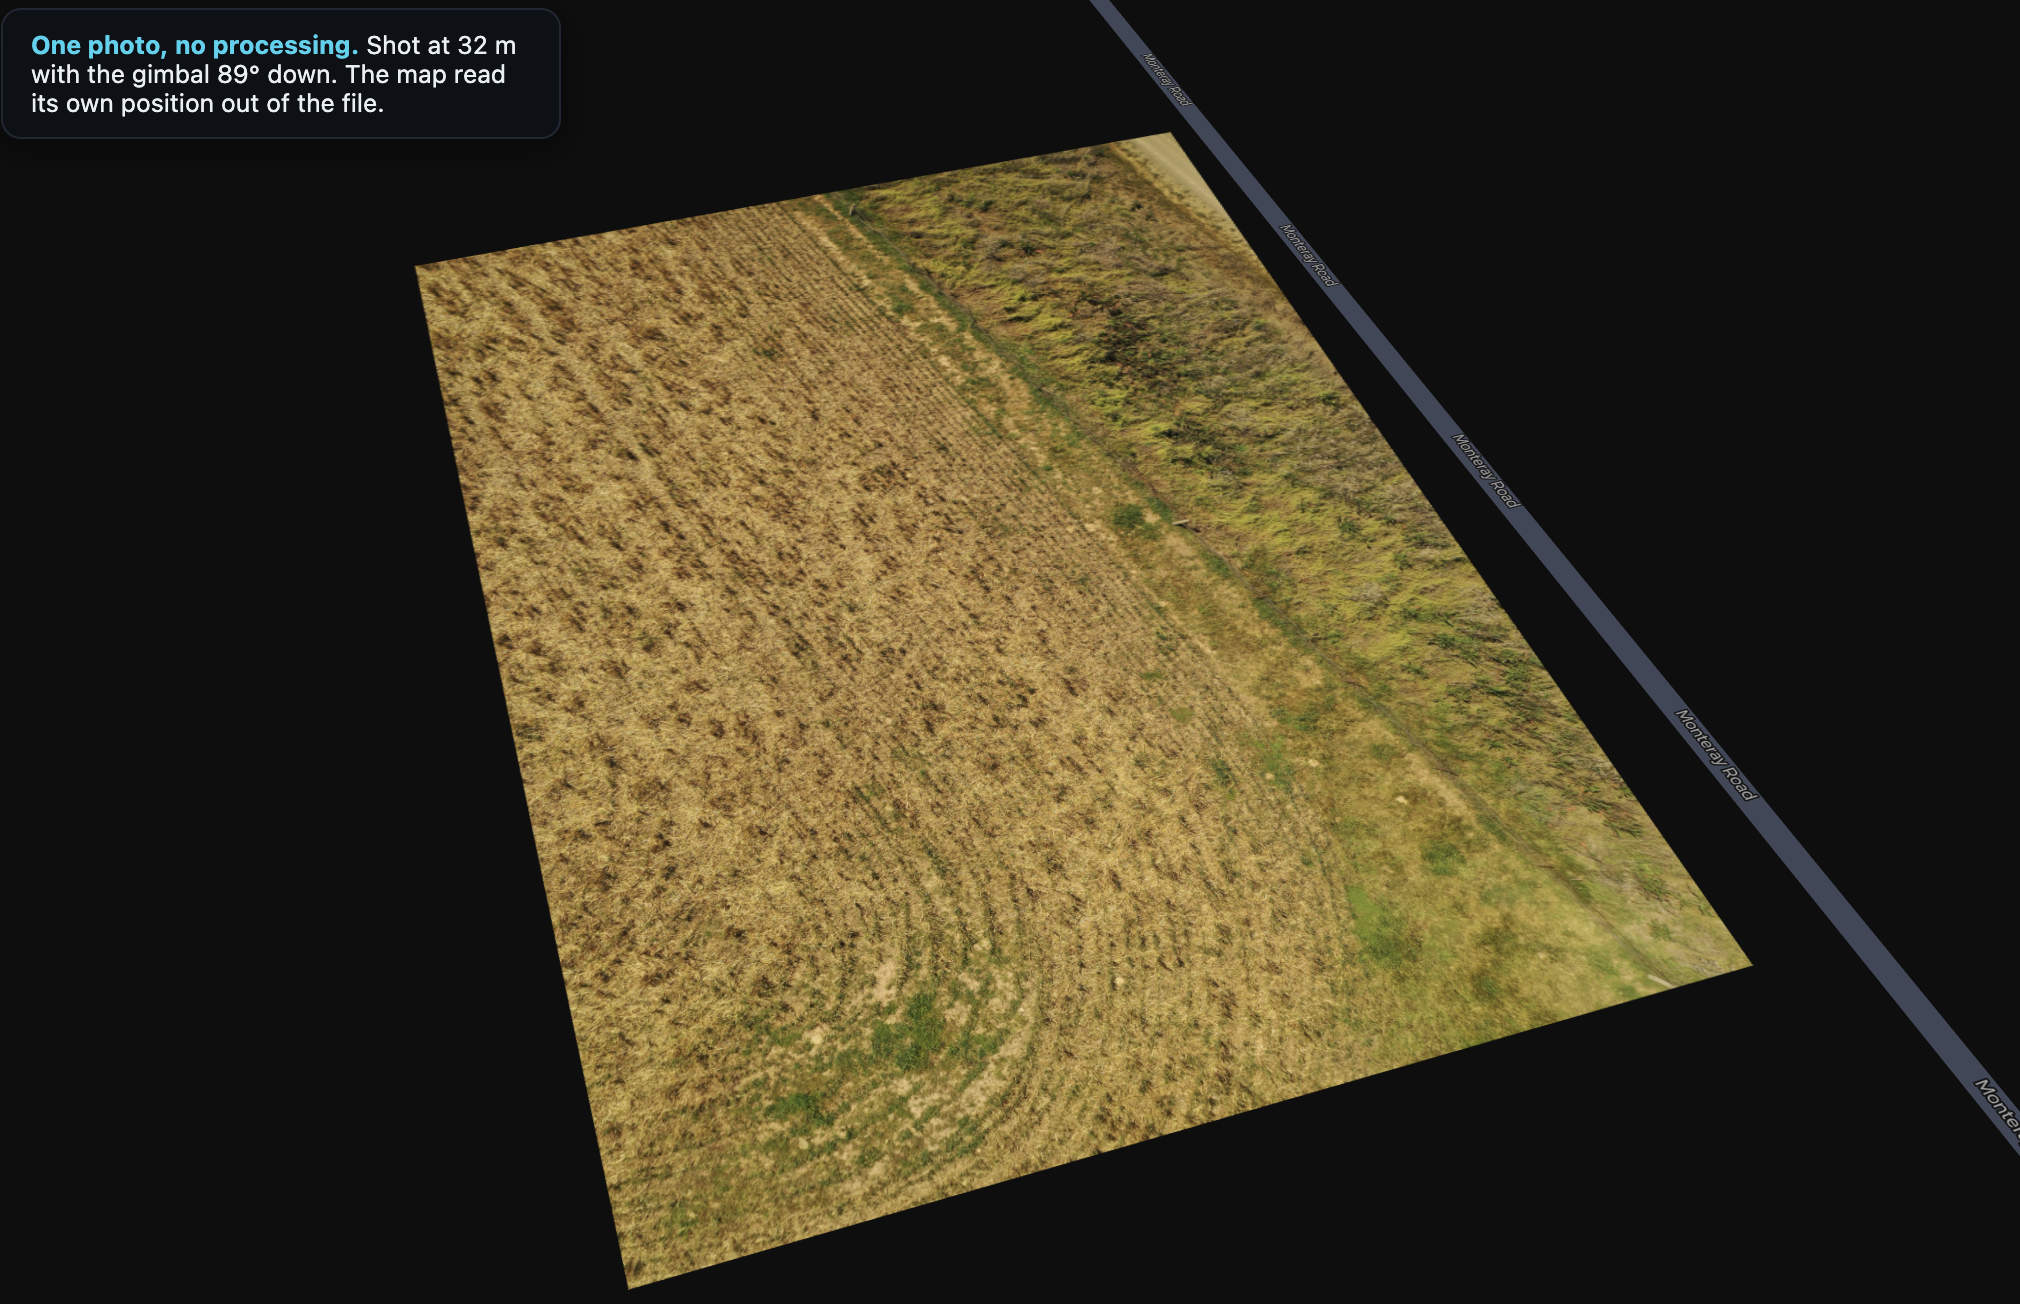
Place a drone photo
ImageOverlay reads GPS, altitude and gimbal angles out of a drone JPEG's EXIF and XMP, then draws the photo at its own ground footprint.

Slice a Zarr cube
ZarrLayer draws one 2D slice of a chunked N-dimensional array. Change select to step a forecast axis without reopening the store.
3D, terrain & lighting
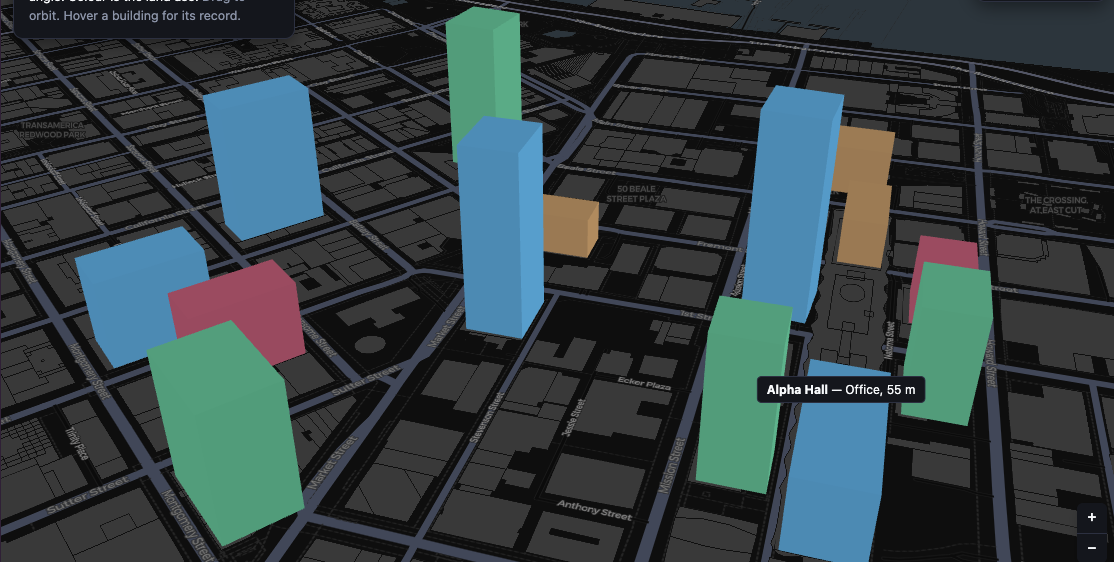
Place a 3D model
Place a glTF or GLB model at map coordinates with ScenegraphLayer. One asset, one instance per row, no three.js.
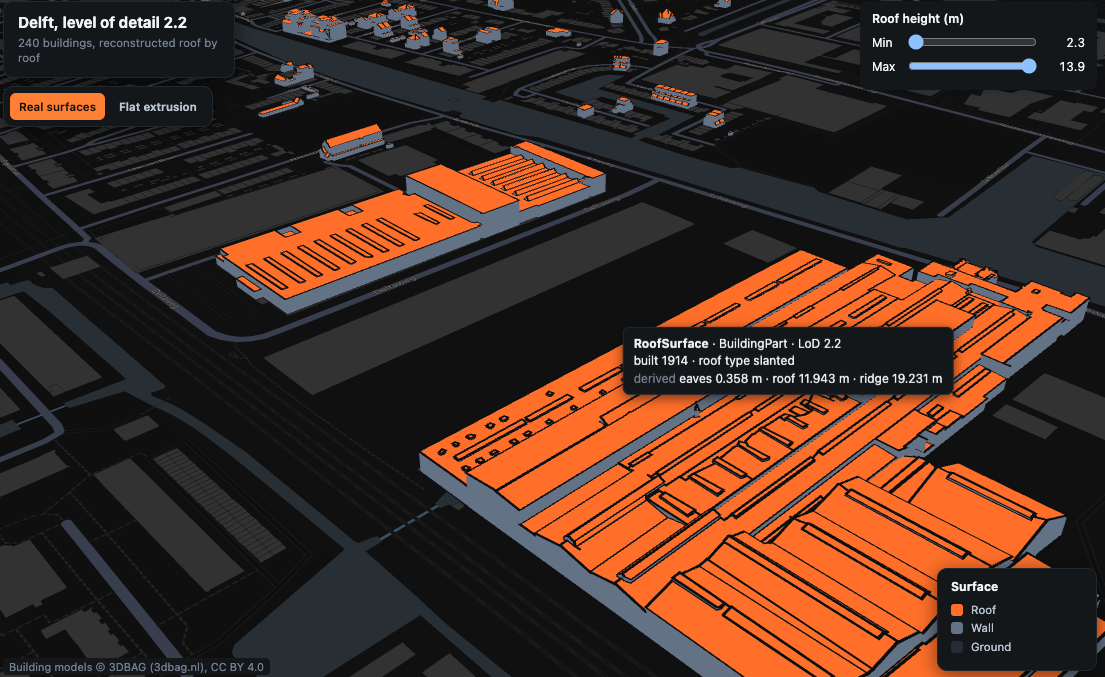
Load a CityJSON model
Load 3D buildings from a CityJSON city model: real LoD 2.2 roof surfaces with SolidPolygonLayer and full3d, or extruded footprints.
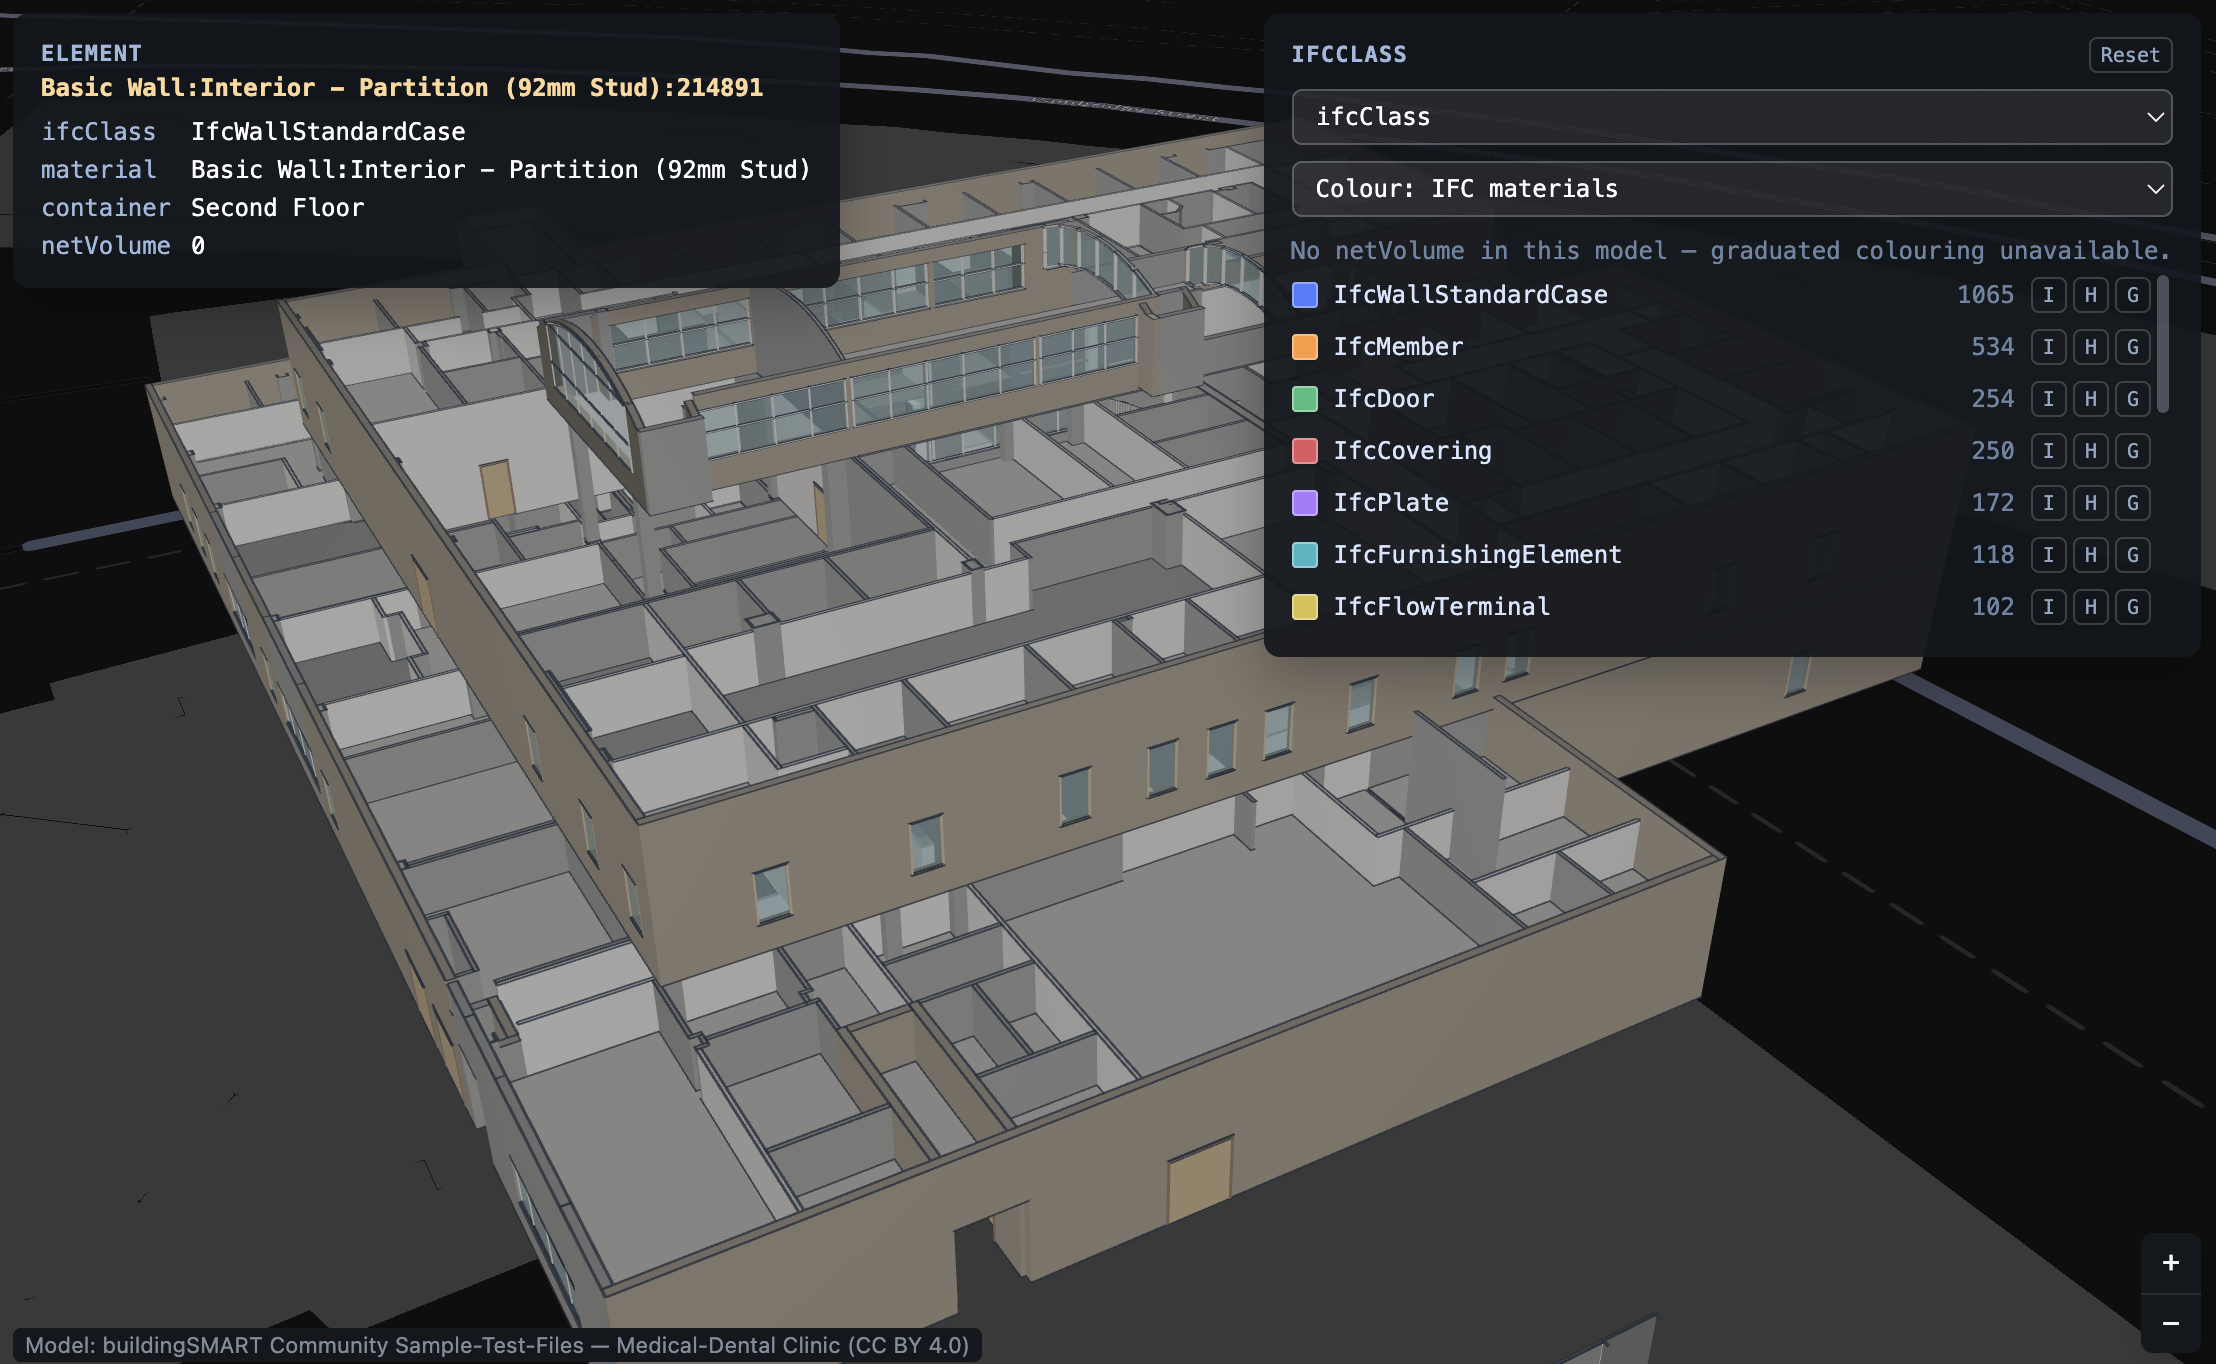
Inspect a BIM model
The BIMLayer load .ifc models in the browser with the ifc-loader widget. Pick any element, isolate or ghost the rest, and clash-test two federated models.
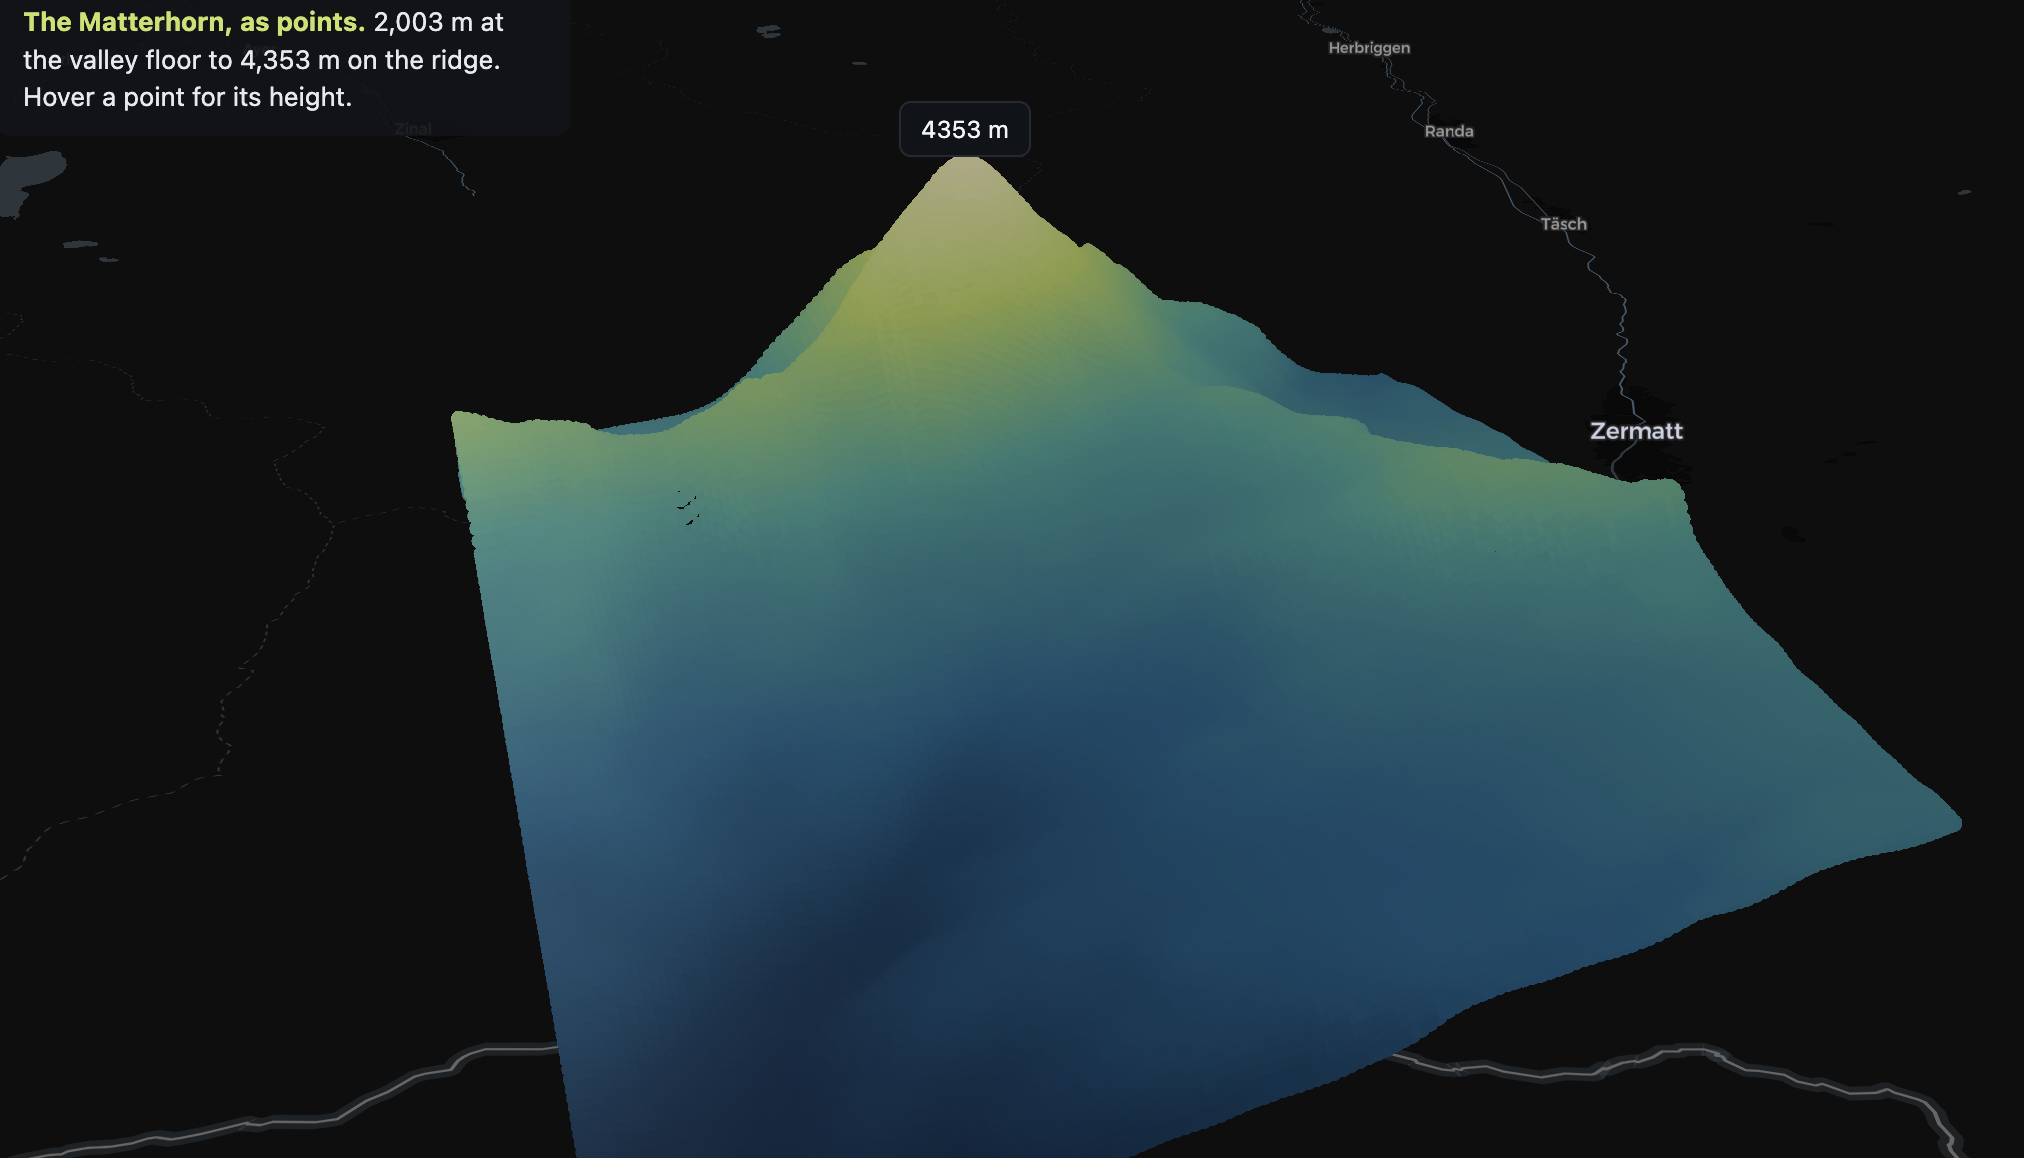
Render a point cloud
PointCloudLayer draws rows that carry a z: 24,336 elevation samples over the Matterhorn, sized in pixels and coloured by height.
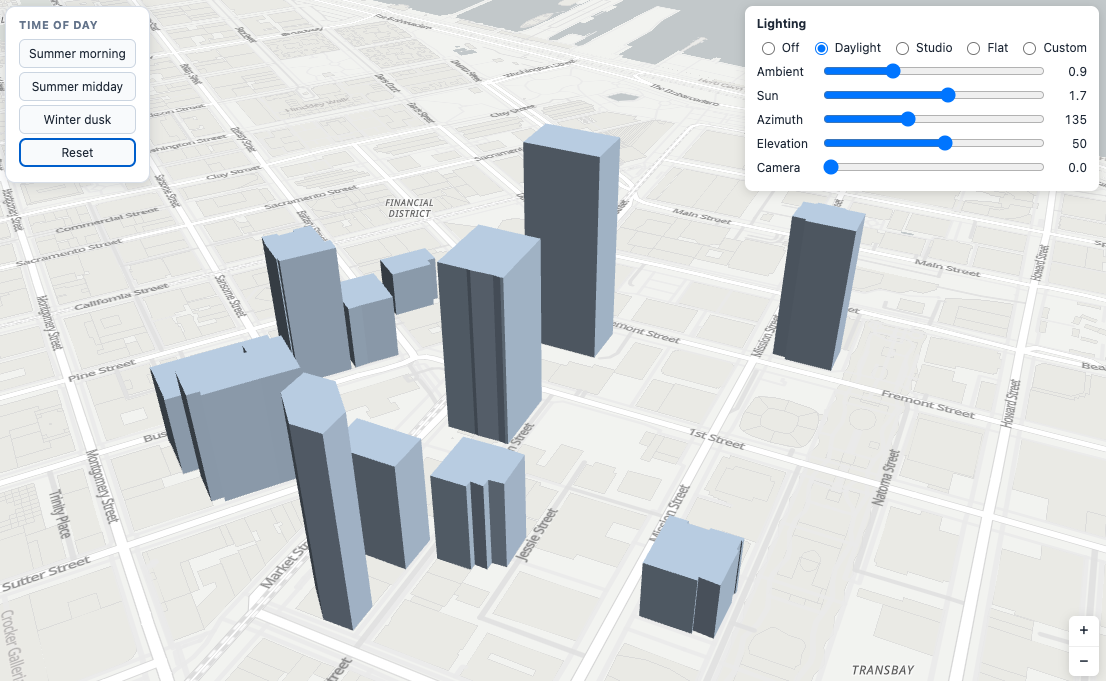
Light the scene
Light extruded buildings with lighting presets, per-value lighting-* overrides, and a sun placed from a date with lighting-sun-date.

Google Photorealistic 3D Tiles
Render Google Photorealistic 3D Tiles through Tile3DLayer. Needs a browser-restricted Map Tiles API key.
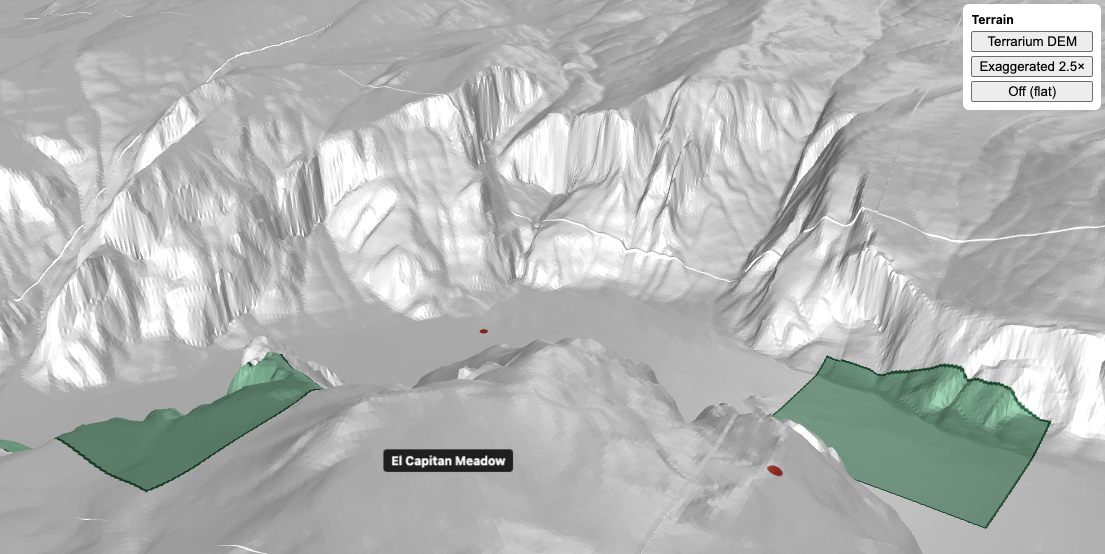
Add terrain
Raise real terrain from a keyless DEM. Geographic layers drape onto the surface automatically.
Stories & animation
Build a map story
Turn a map into a guided tour. Steps fire actions on a timeline, with play, pause and scrub.

Google 3D Tiles flyby story
Fly a camera across photorealistic 3D Tiles as a scripted story, with a player and a scrubber.
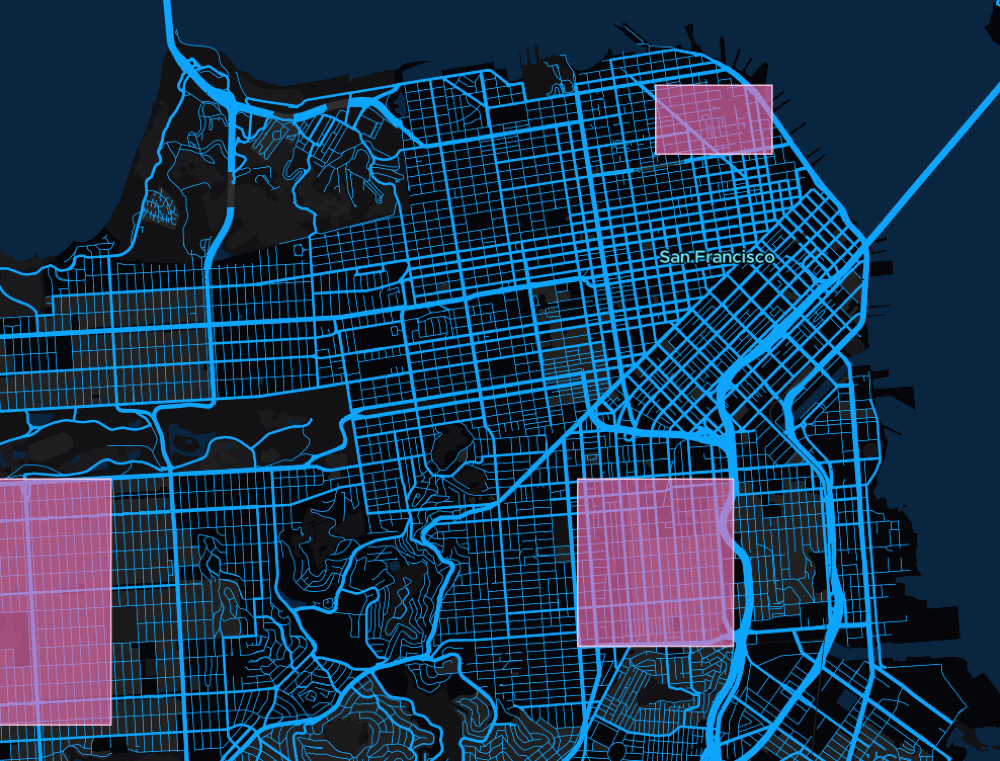
Shift basemaps on a timeline
Swap MapTiler basemap styles from a story timeline while the map runs. Layers and the camera hold steady as the ground changes underneath.
Print & cartographs
Sources
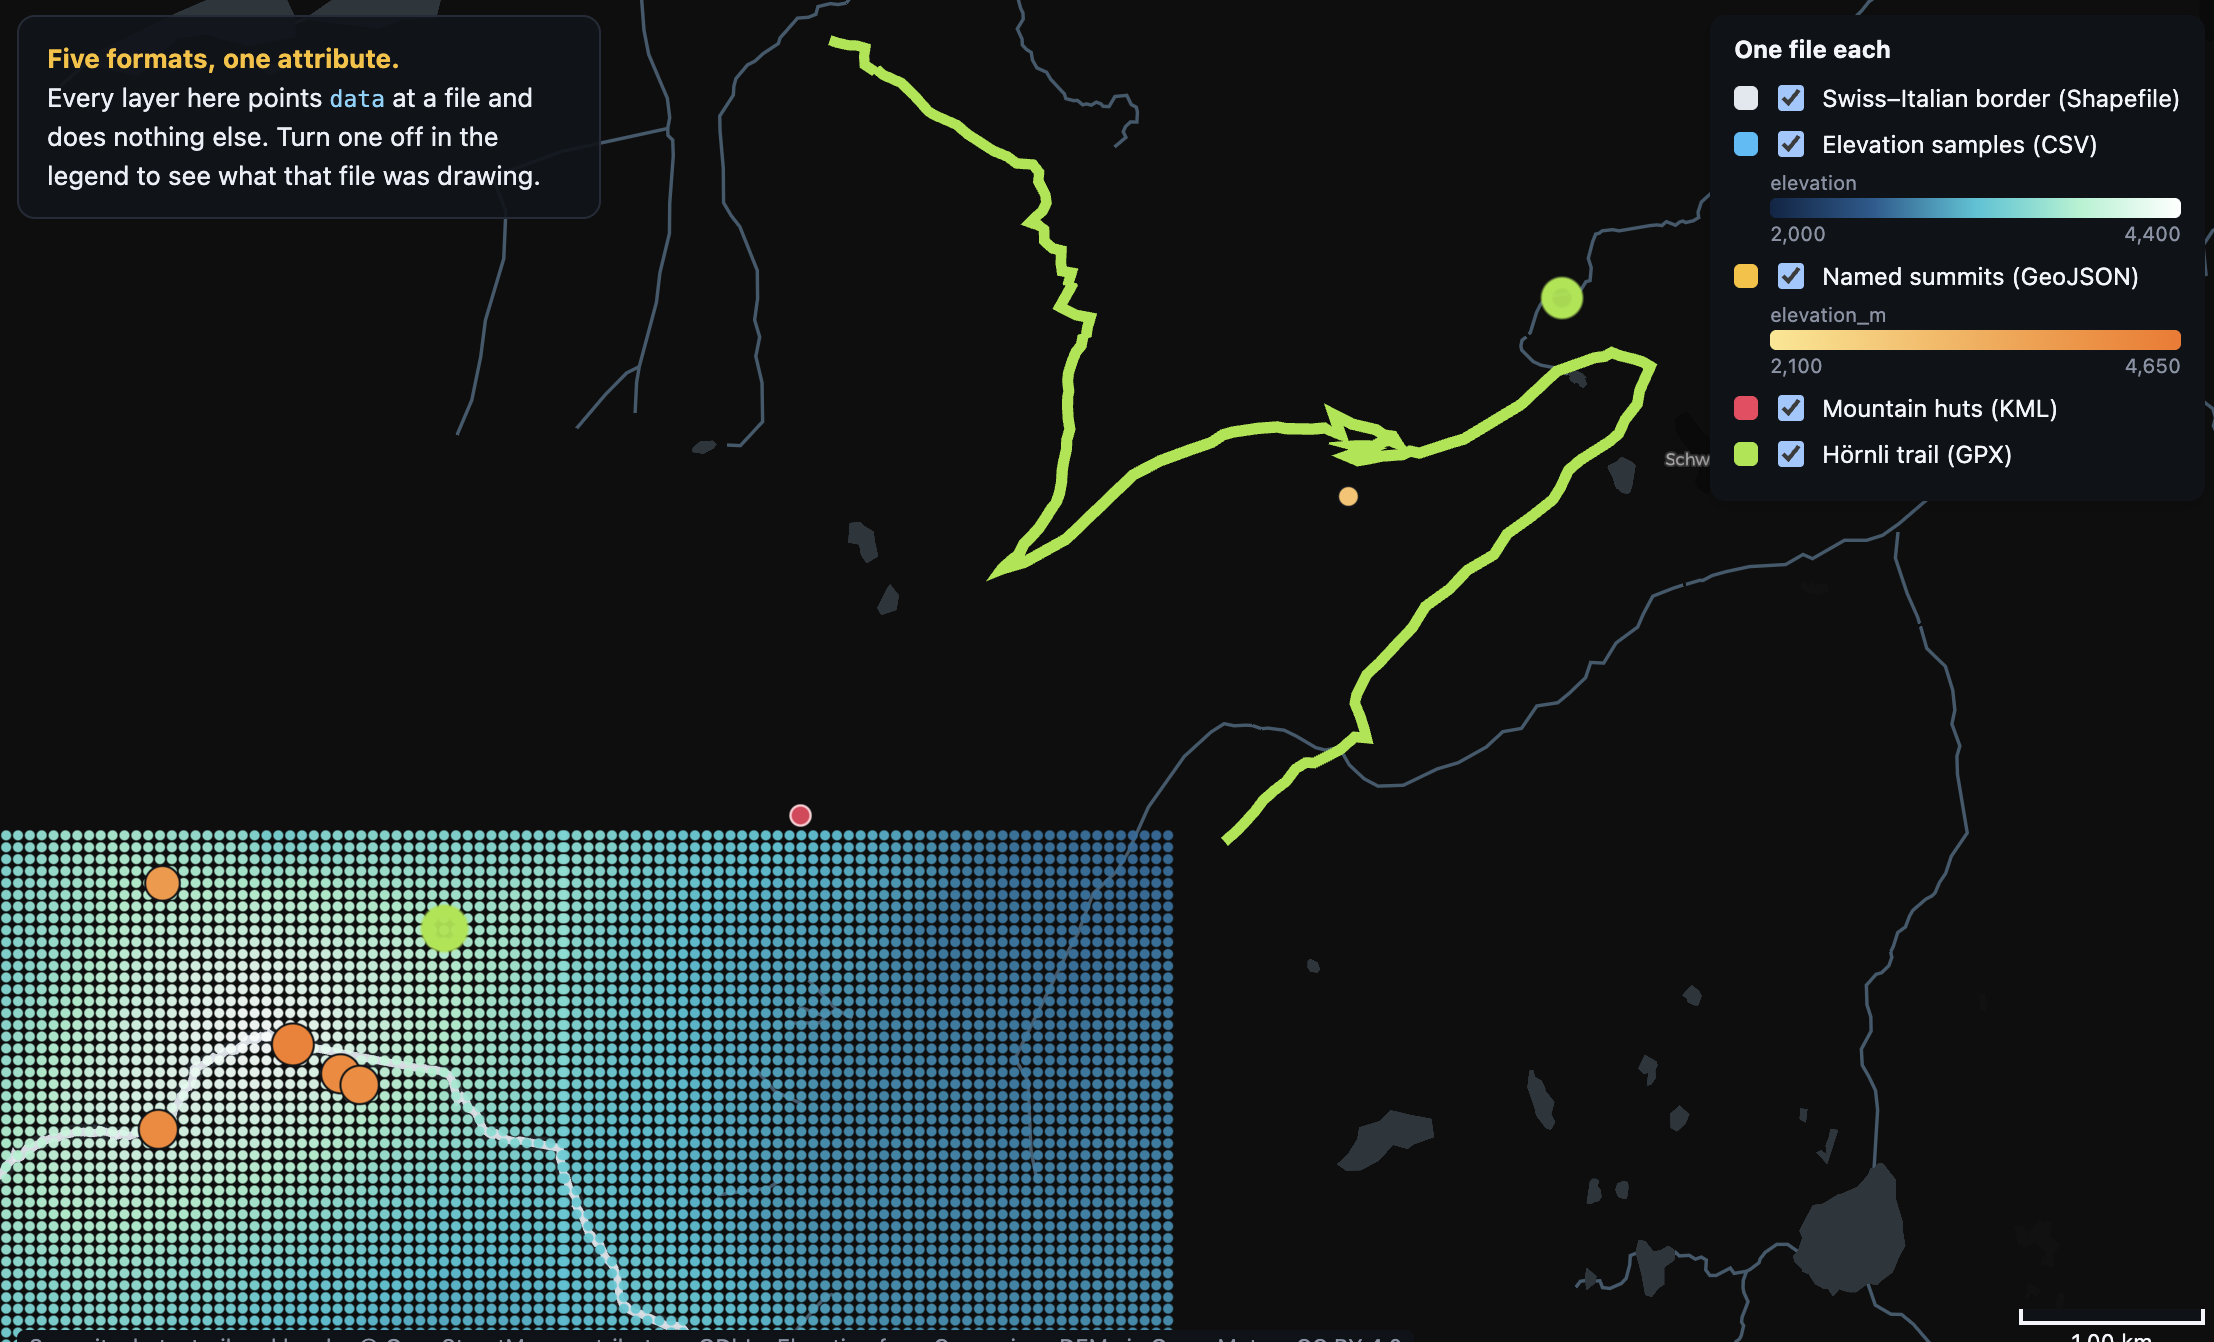
Load a file
Read GeoJSON, CSV, Shapefile, KML and GPX through one data attribute. The file extension picks the parser; nothing above it changes.
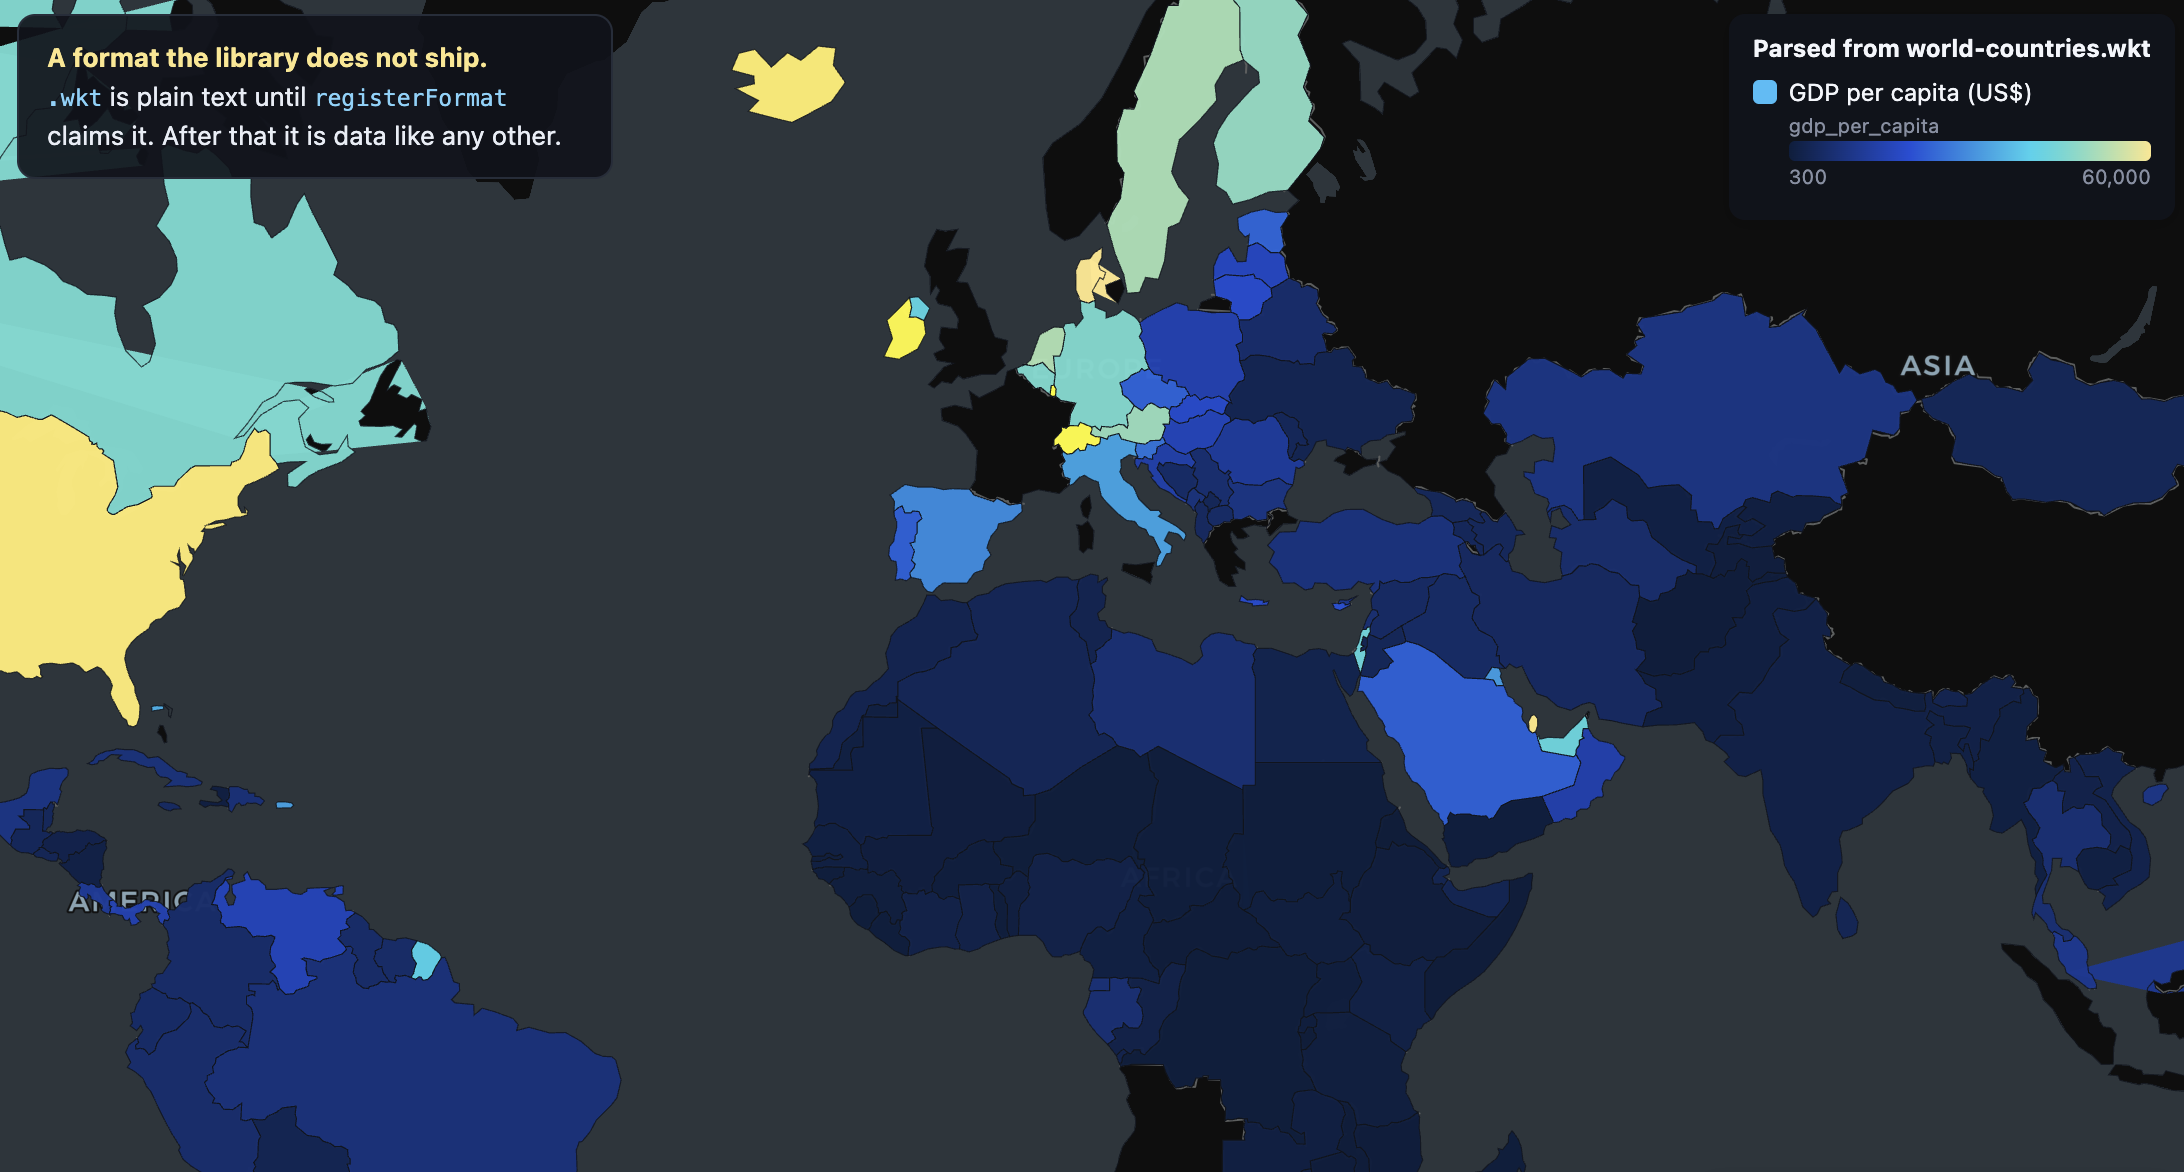
Extend the data layer
Teach the map a format it does not ship with registerFormat, and decode a live socket feed with registerSource.
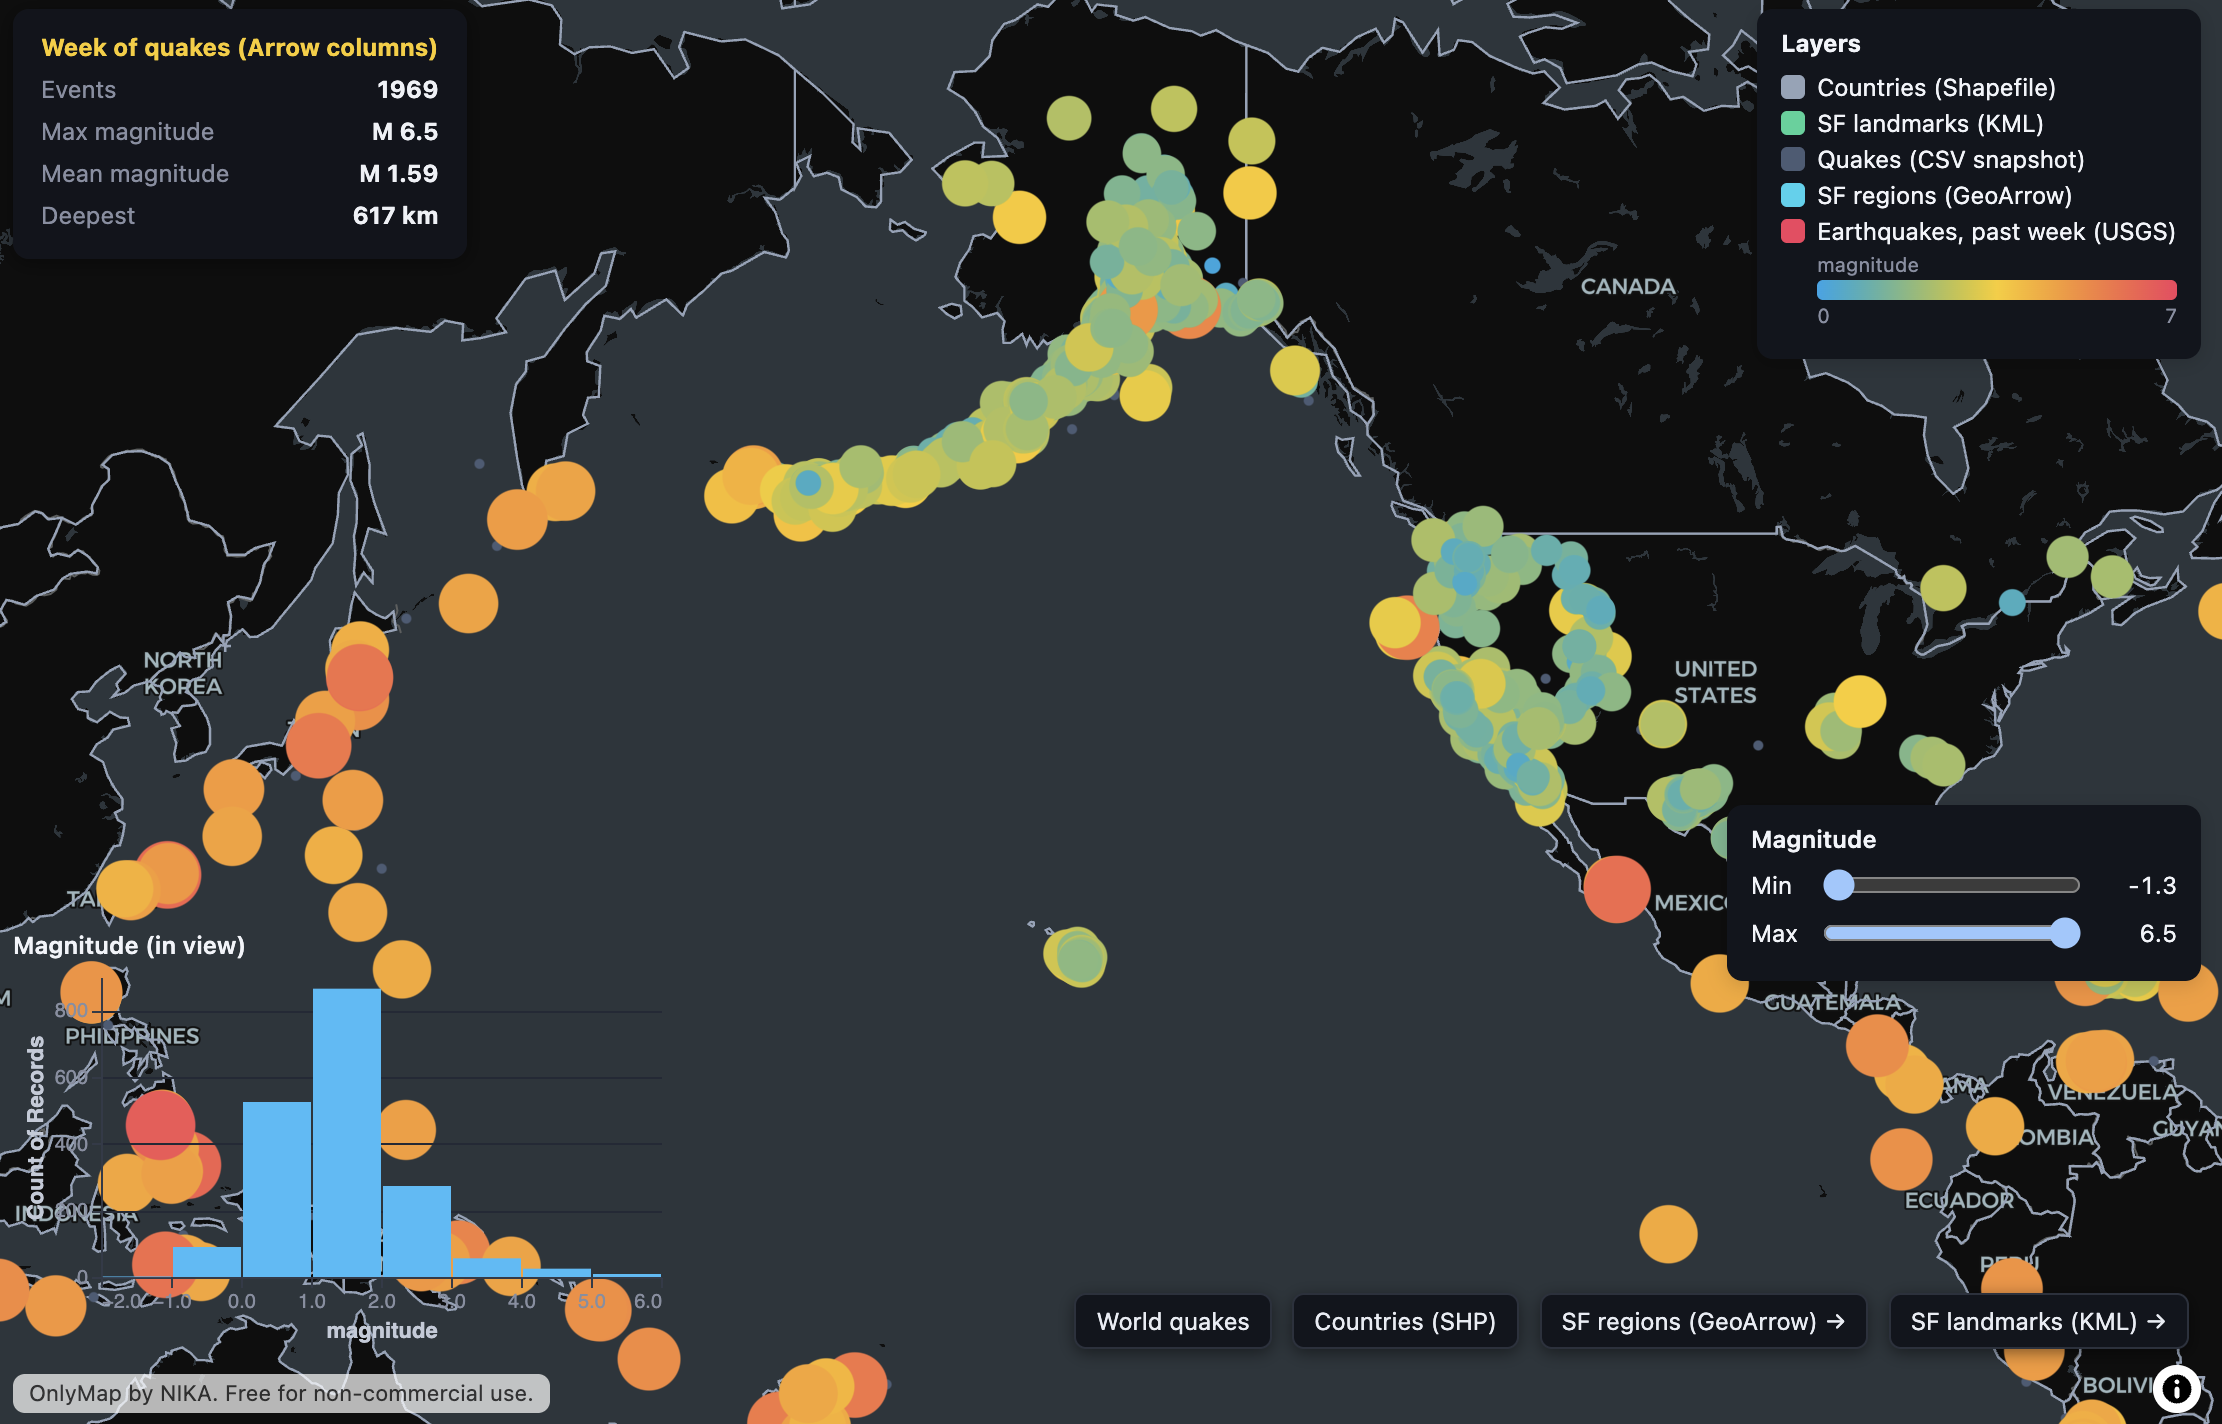
Load columnar data
Load an Apache Arrow file with a GeoArrow geometry column, plus CSV, Shapefile and KML on one map. Columns feed the layer with no row objects.
Styling
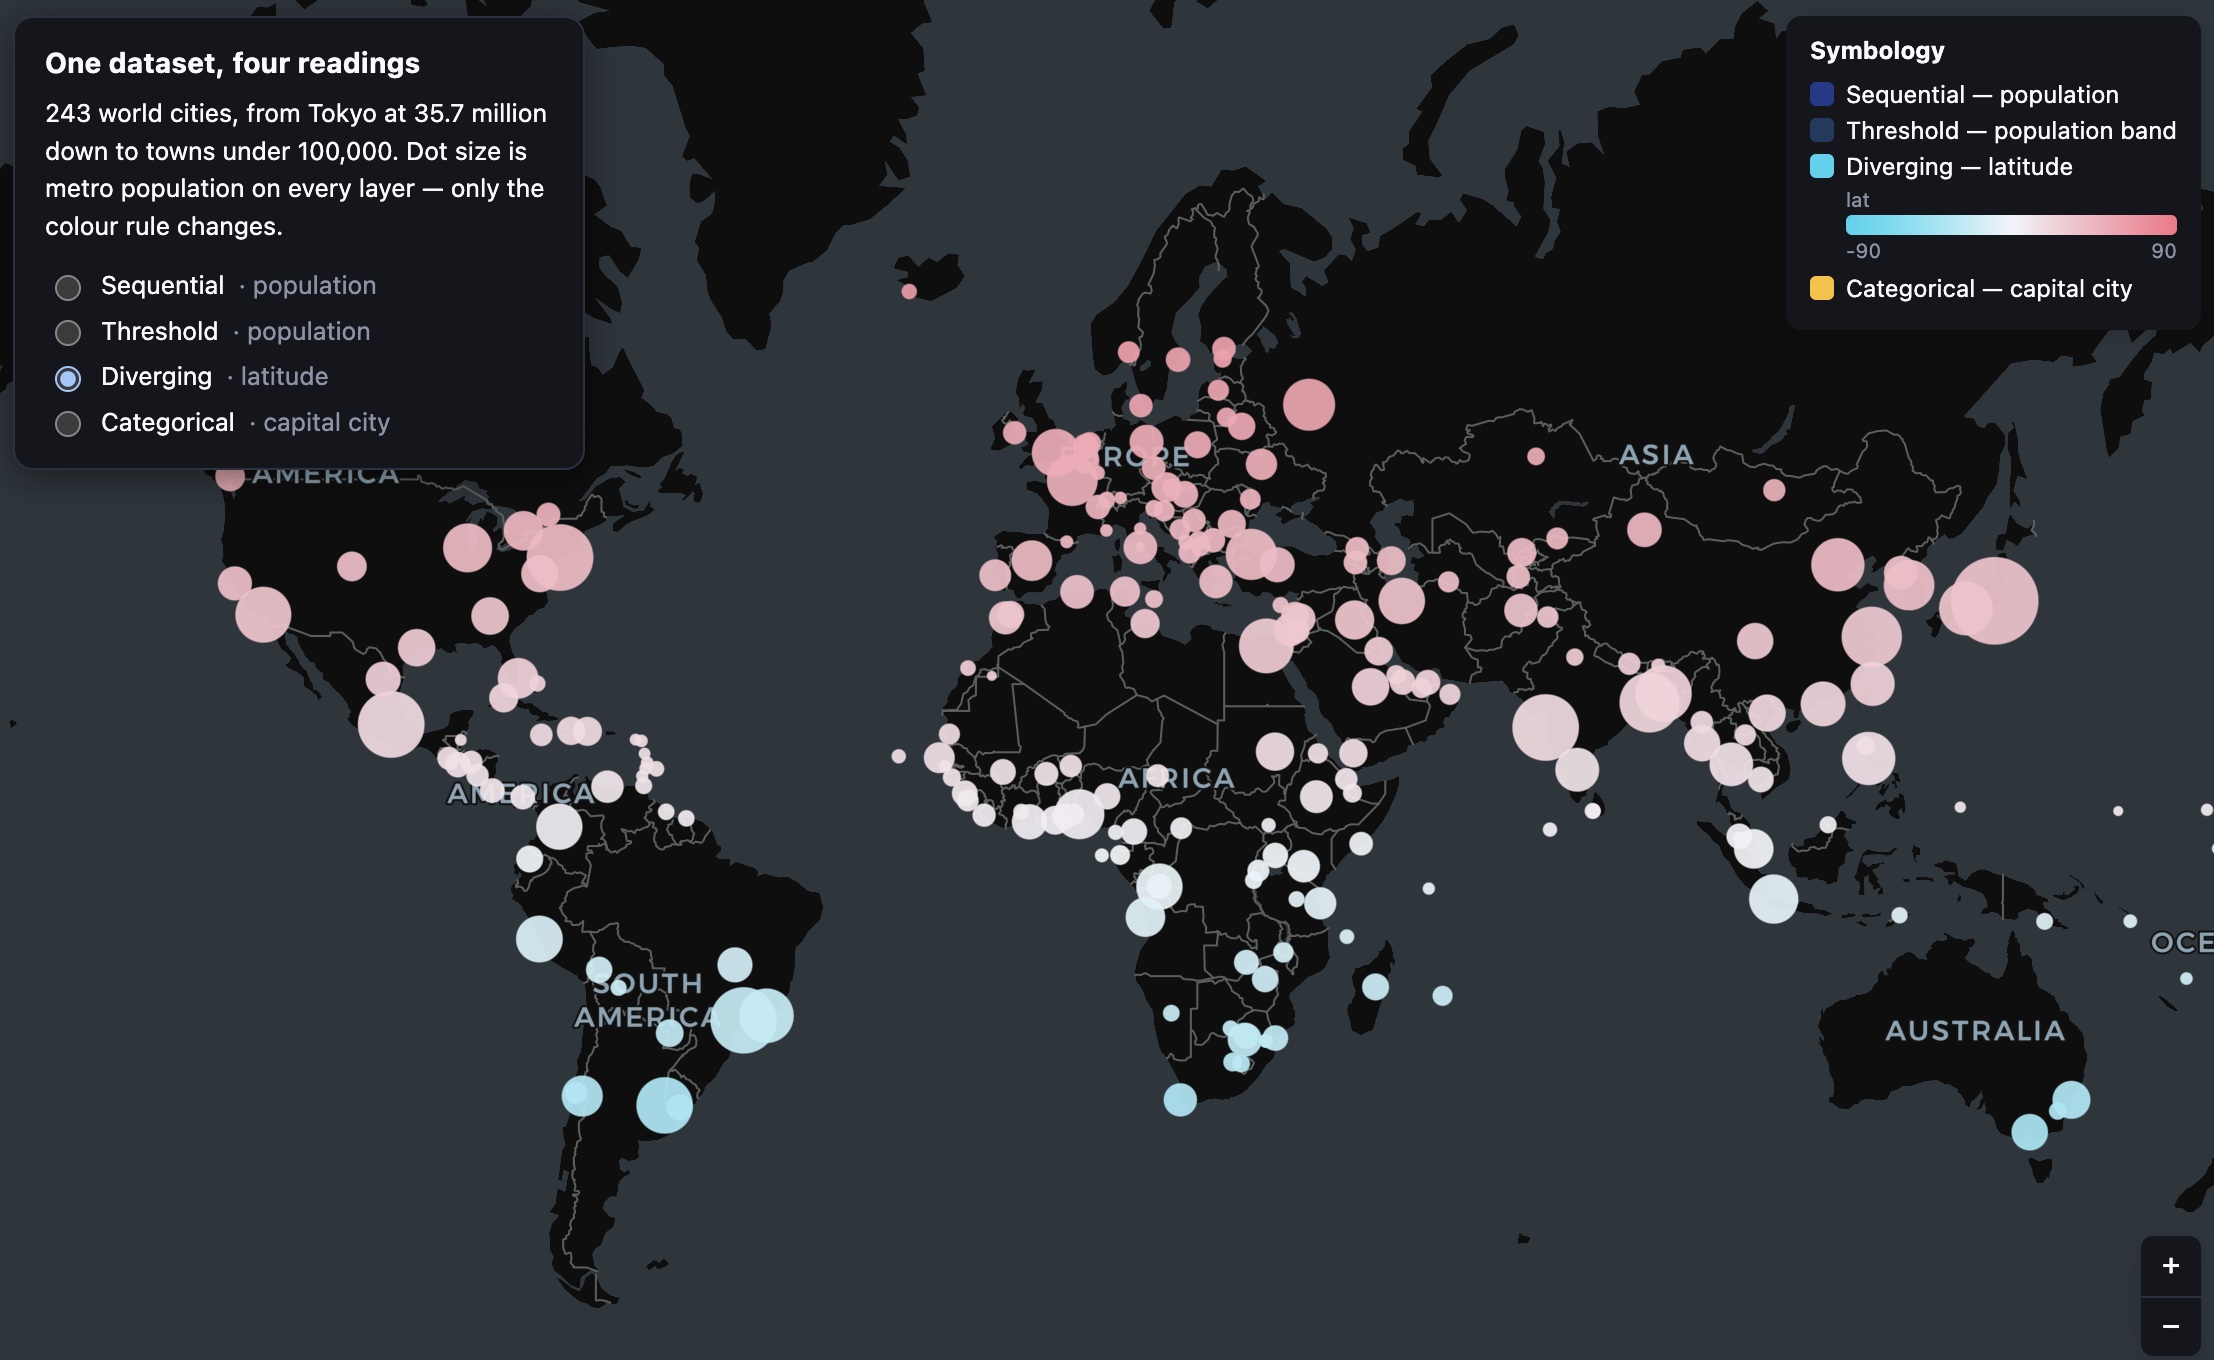
Colour and size by data
Colour 243 cities four ways with scale(): sequential, threshold and diverging ramps, a categorical ternary chain, and sqrt sizing.
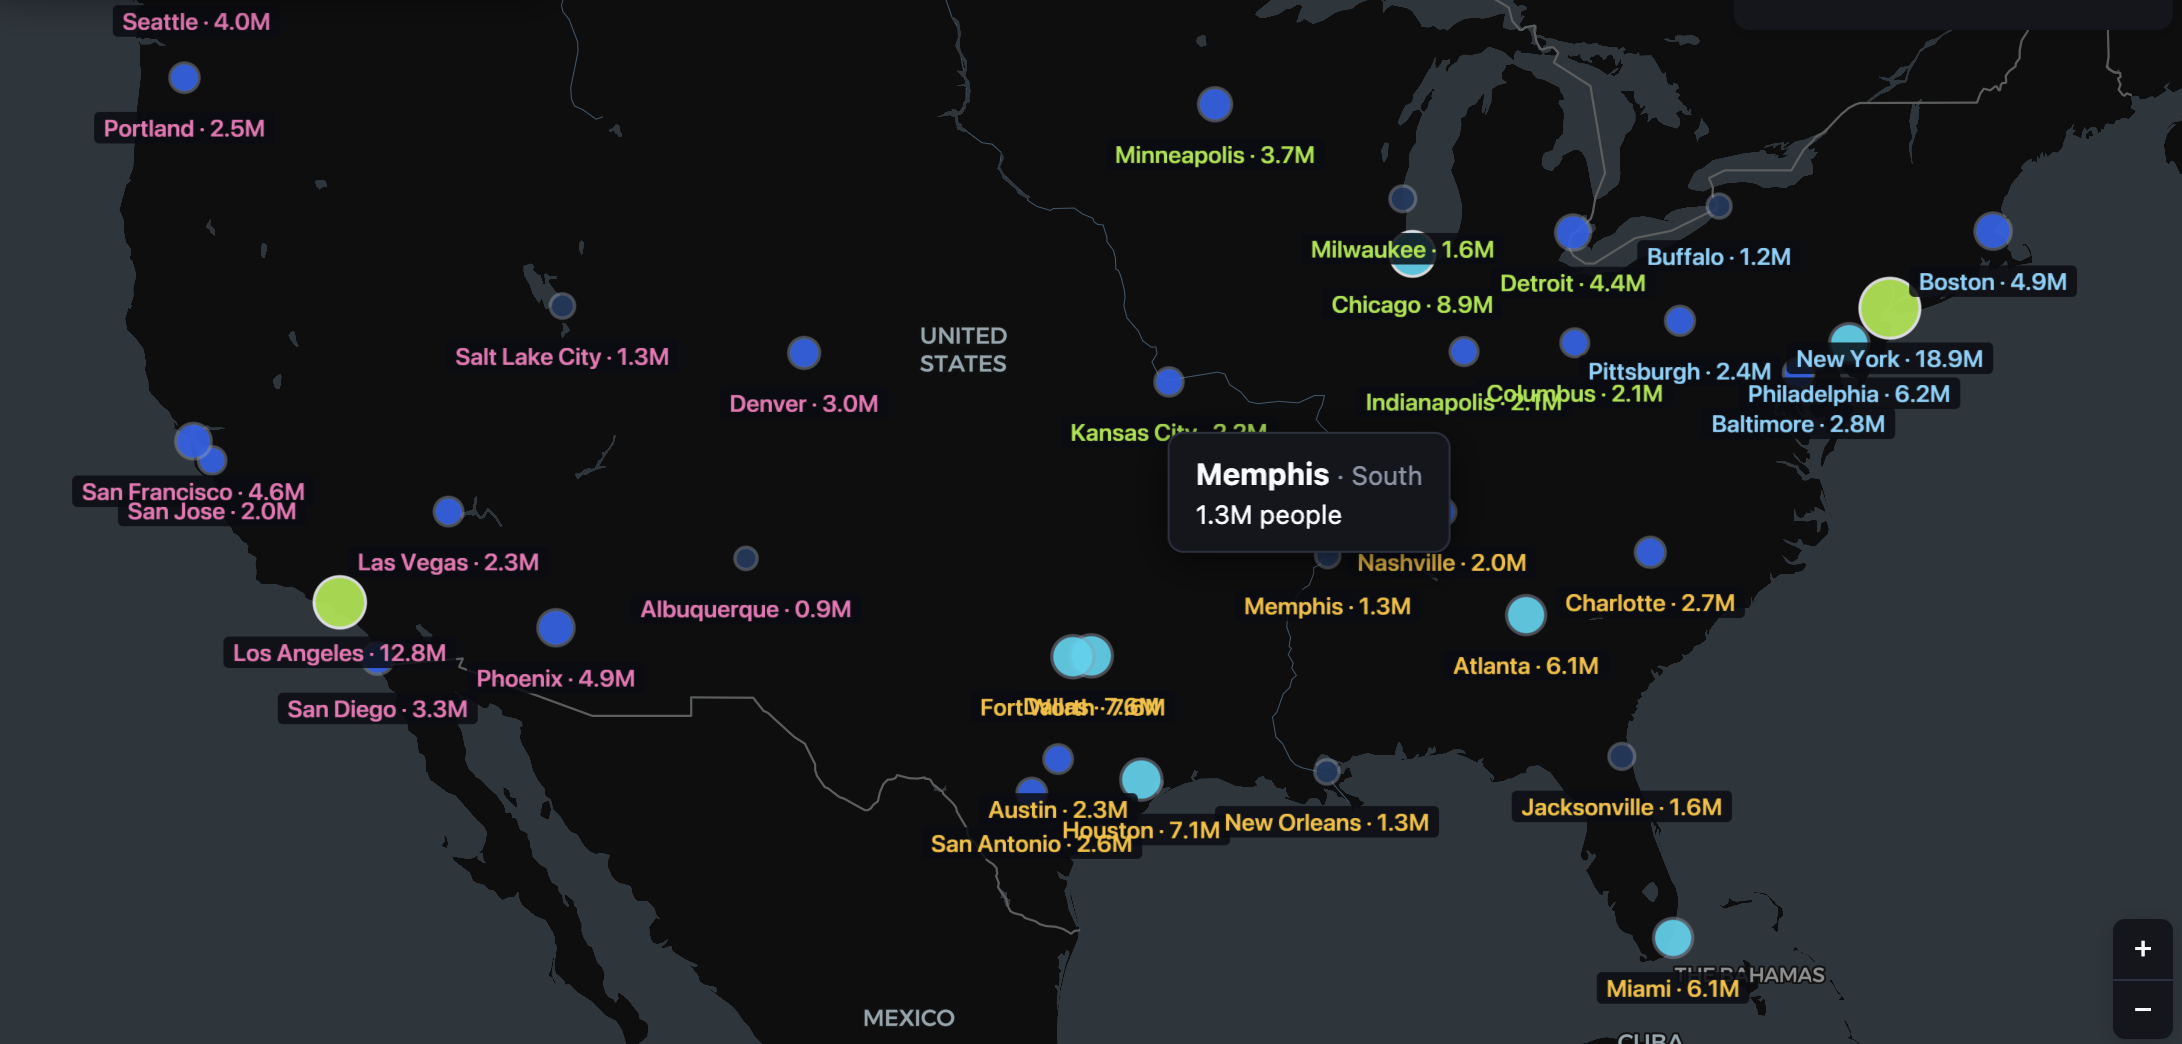
Write accessor scripts
Group accessors in a script type="om/accessors" block, then opt into full JavaScript with js for lookup tables and string work.
Interaction
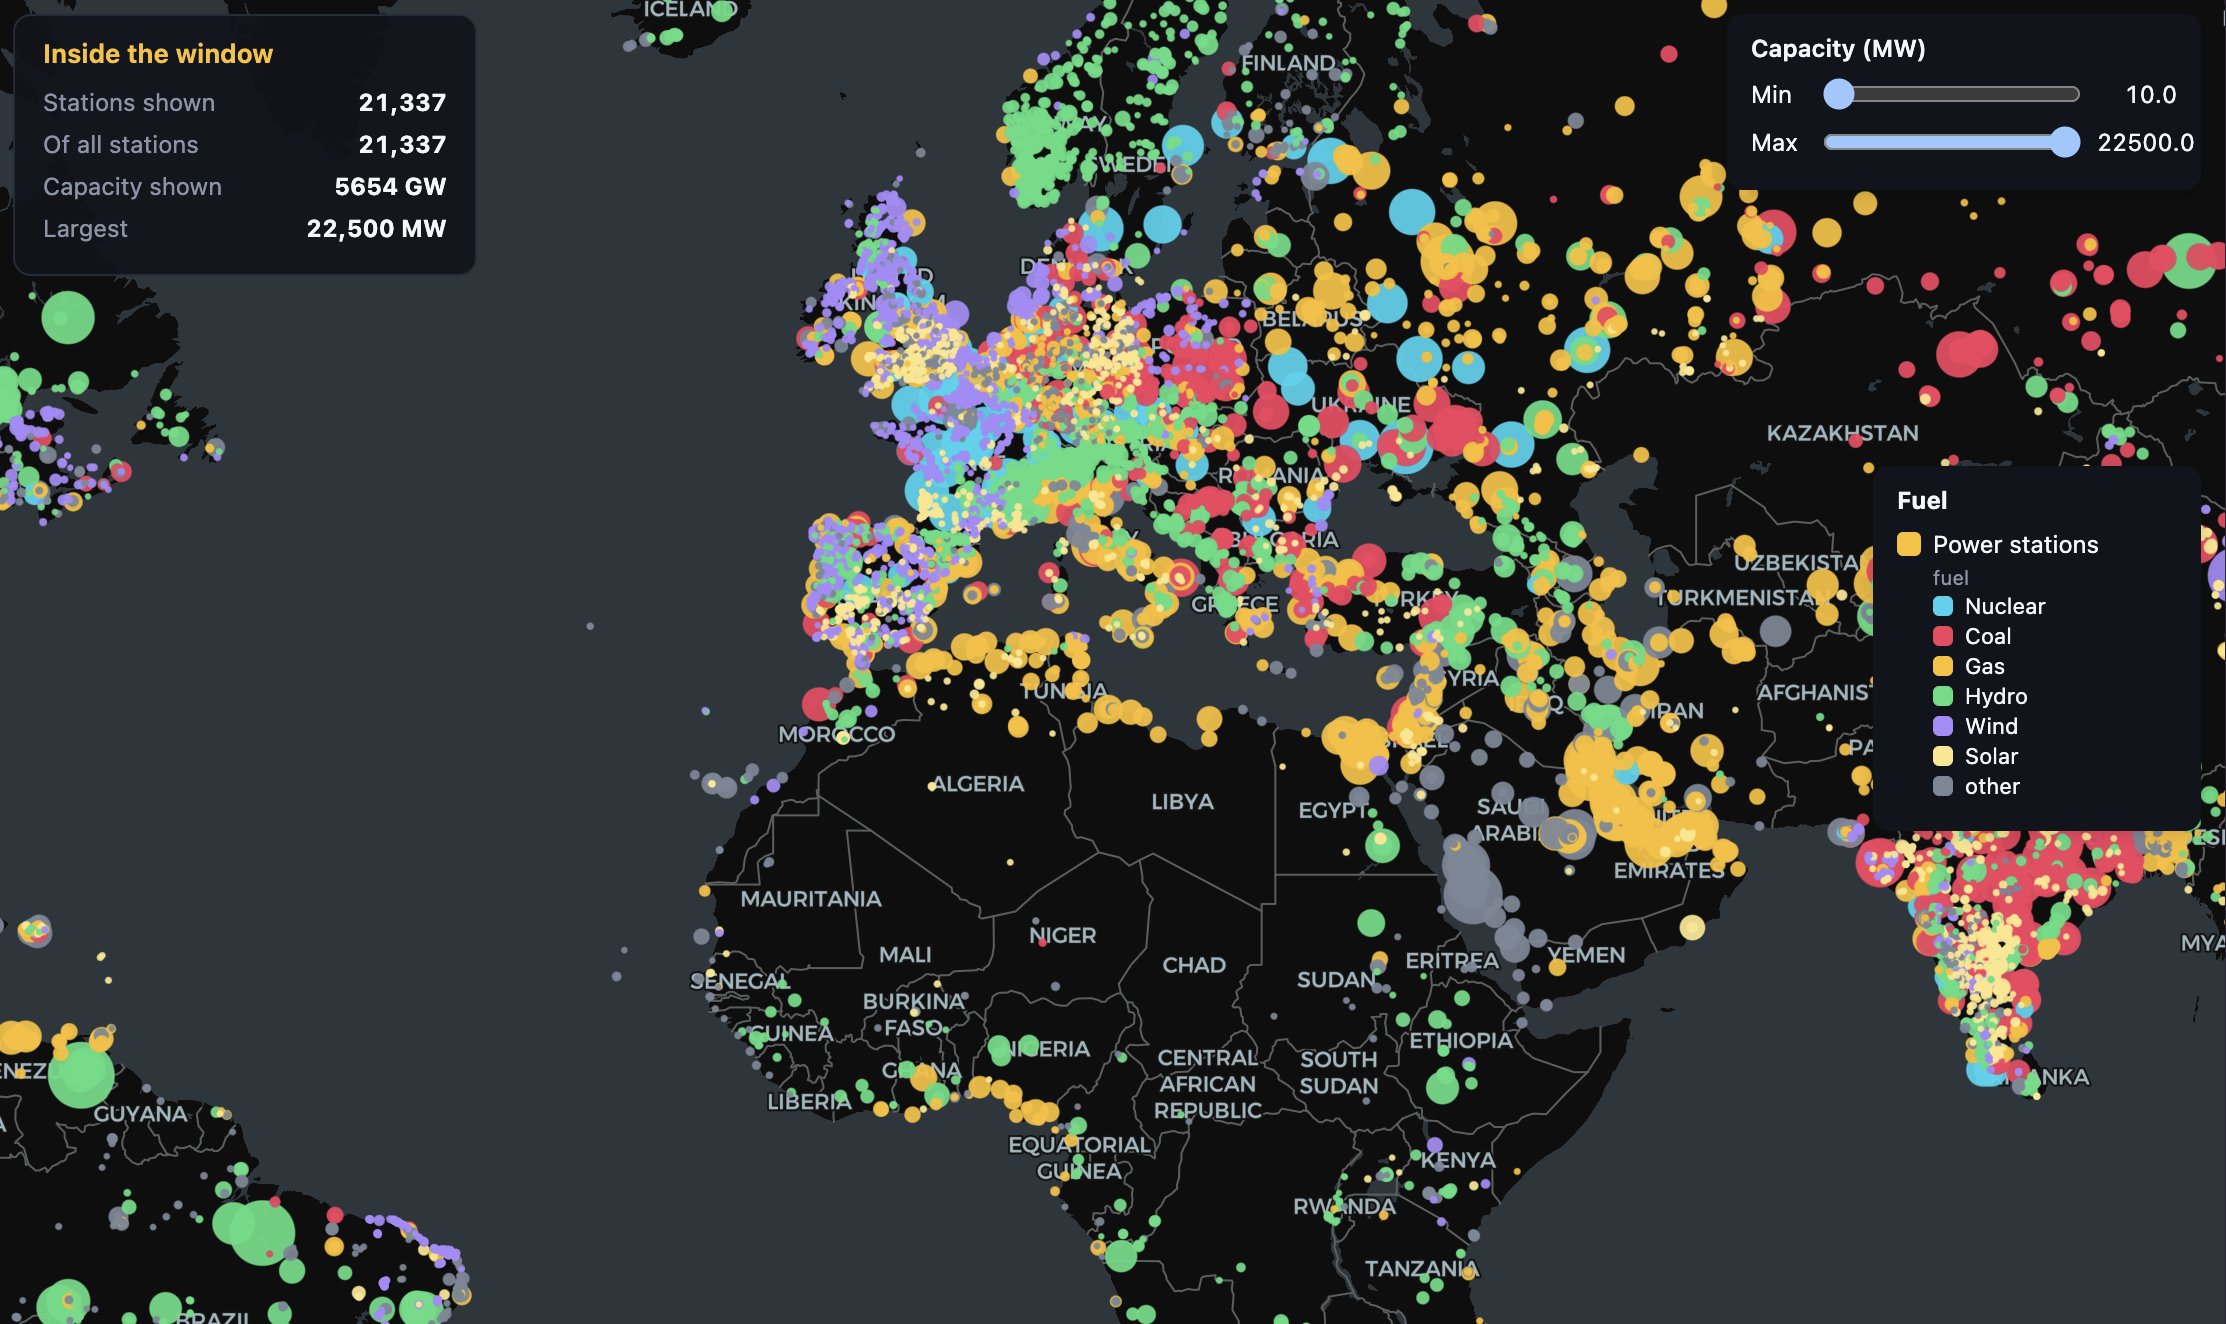
Filter on the GPU
Cut 21,337 points live with filter-field and filter-range. The DataFilterExtension drops rows in the shader, so ctx.stats always agrees.
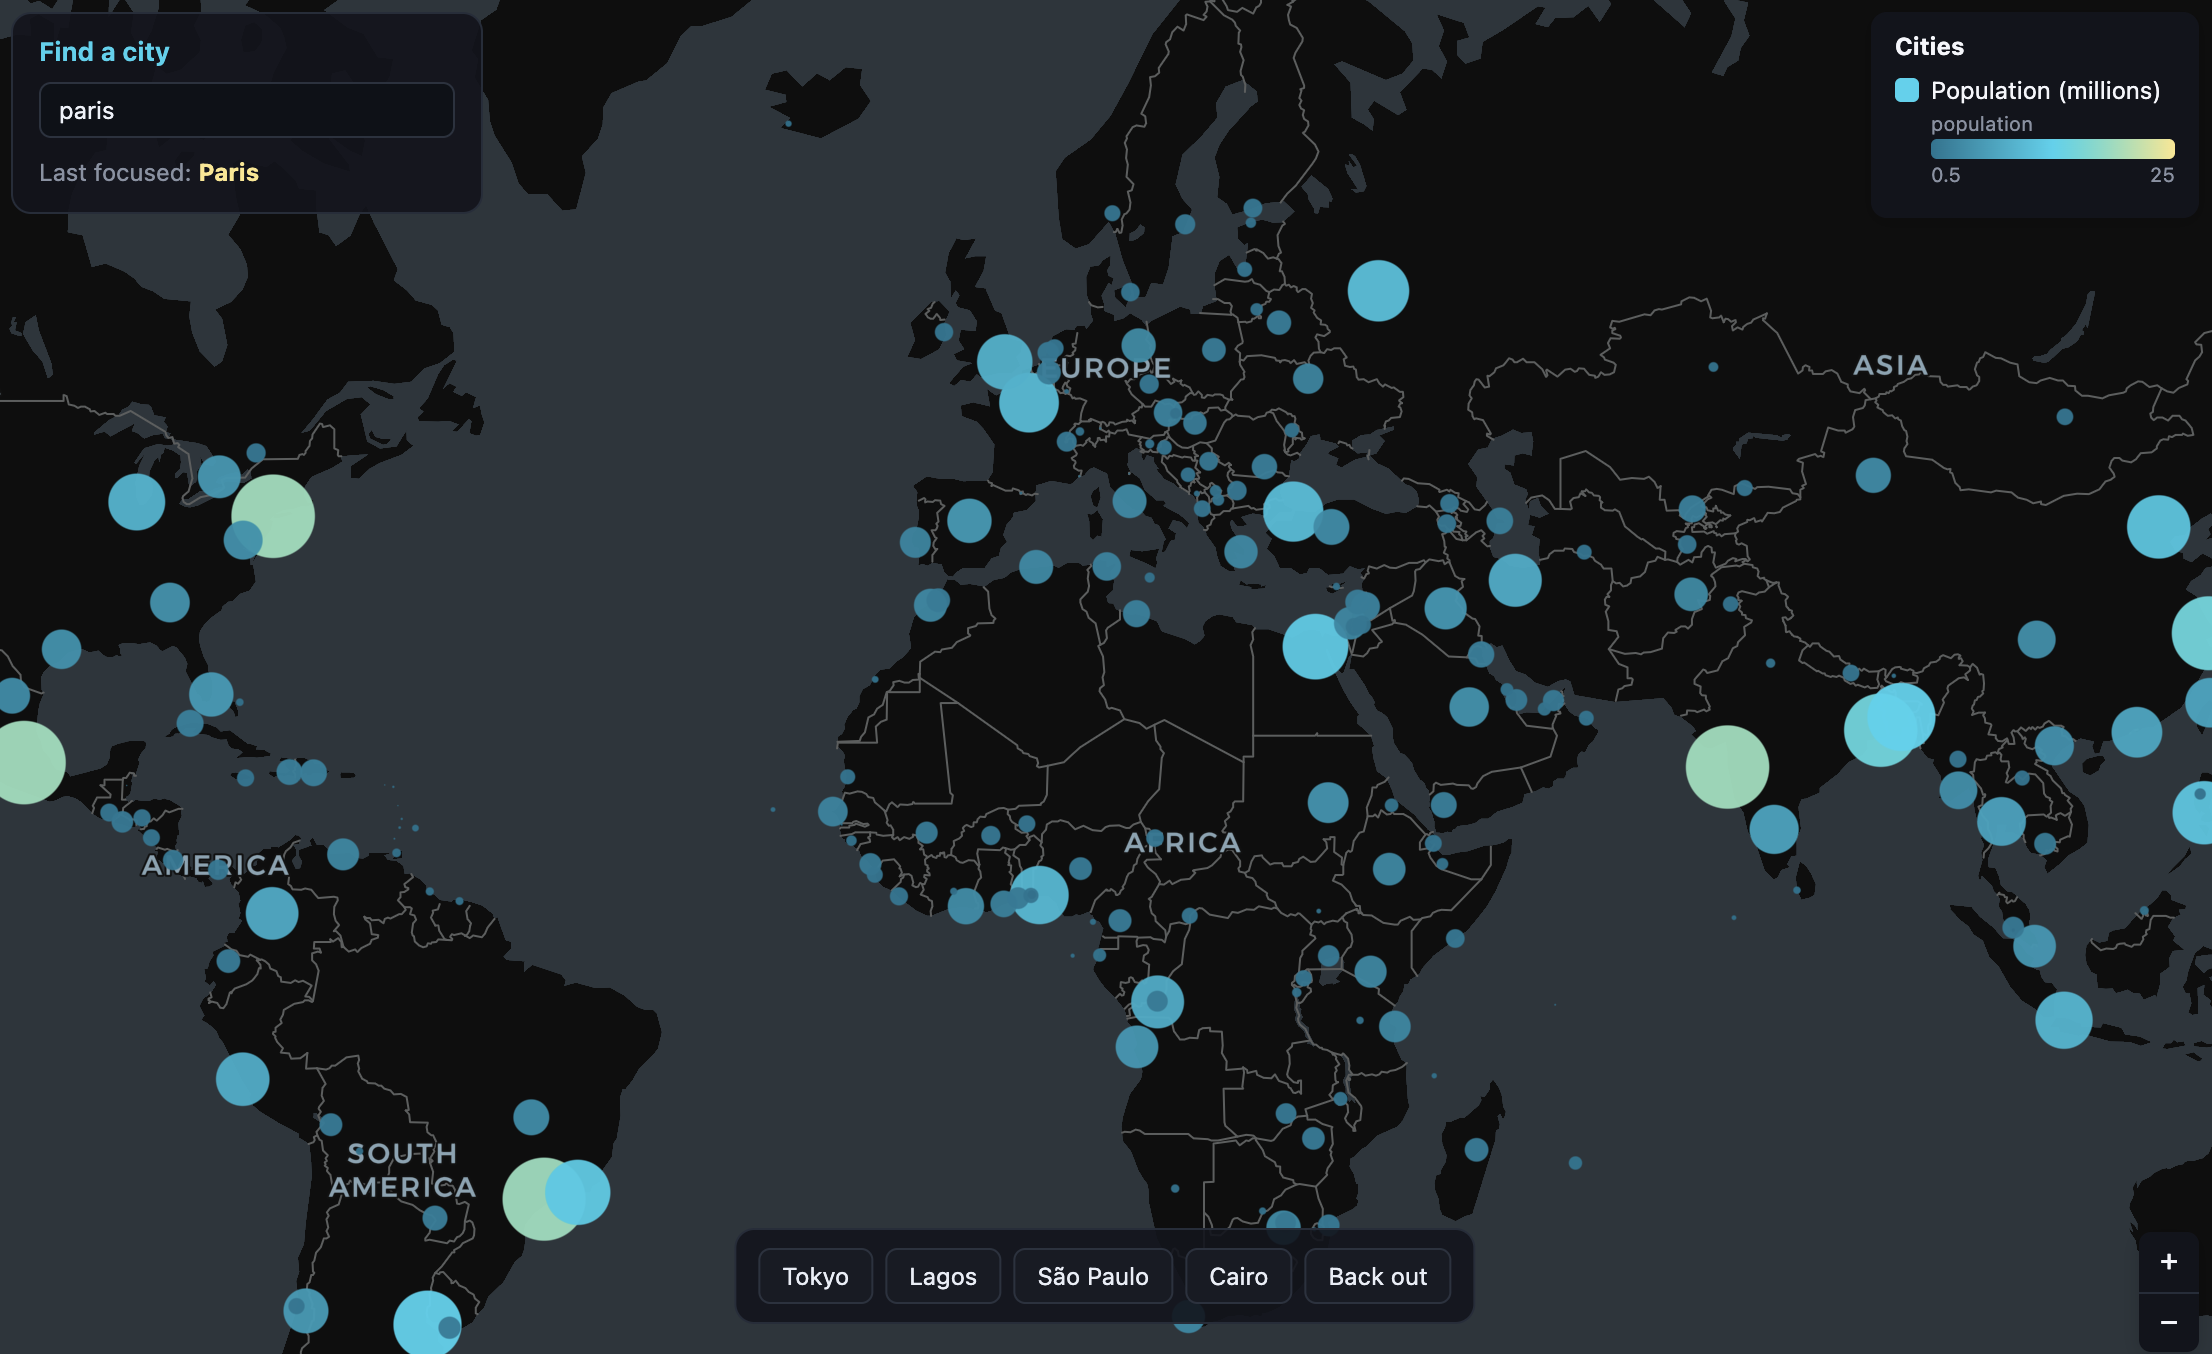
Emit and register actions
Fire one custom action from a behavior, a data-emit button and ctx.emit. registerAction defines the name and the payload once.

Undo and redo
Step layer toggles, filters, basemaps and sketches back with the undo-redo widget or Cmd/Ctrl-Z. Camera moves are not undo steps.
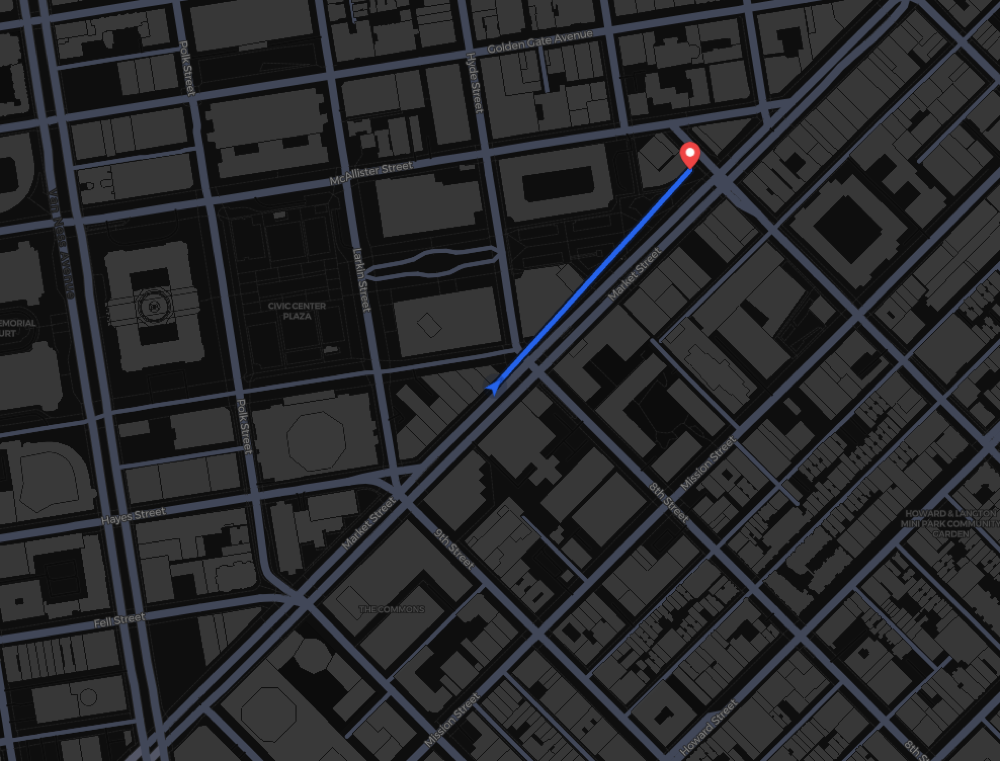
Routing & Tracking
Draw a styled route from a LineString with the Route layer, and glide a bearing-rotated Tracking marker between position fixes. Both expand into plain deck.gl layers.
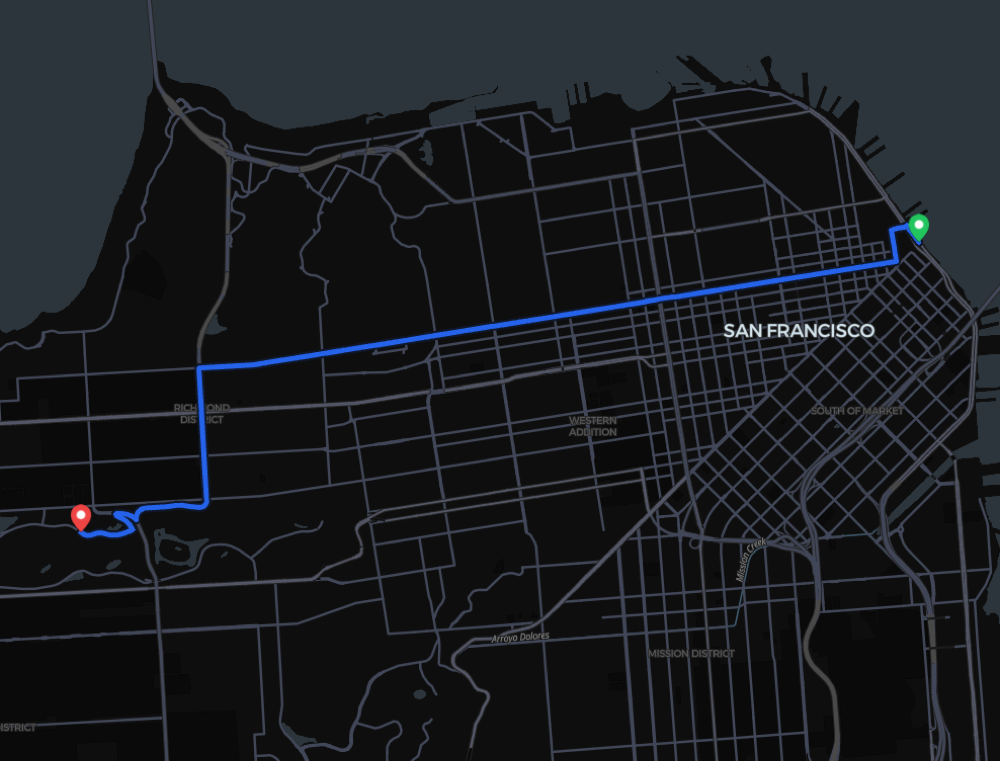
Compute a Route
Click two points and a registered RoutingProvider computes the street-following drive from OSRM. The click handler only writes origin and destination attributes.

Time series
Step a month of USGS earthquakes through time with a custom slider widget that drives a GPU filter.
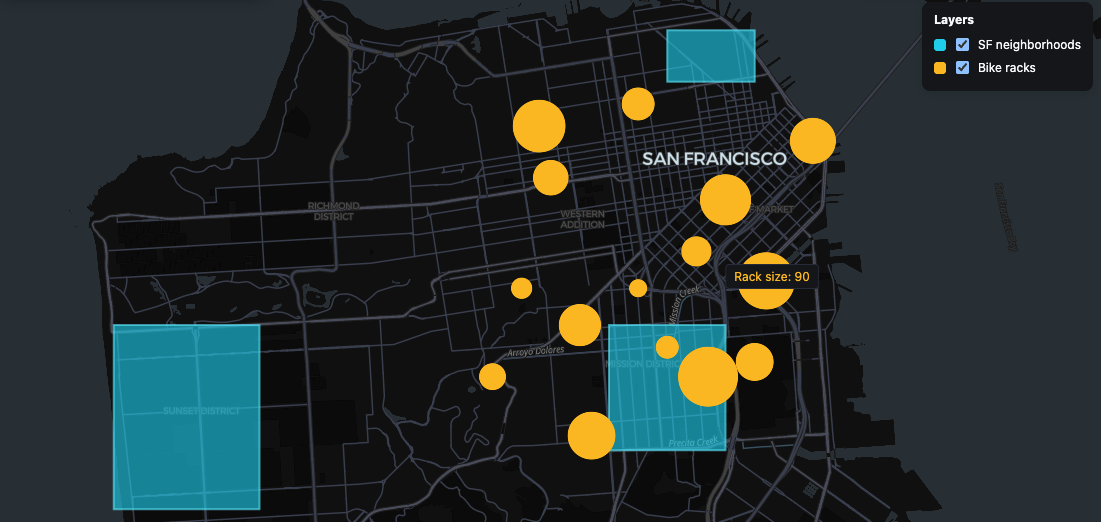
Wire up behaviors and overlays
Click a neighborhood for a popup, hover a bike rack for a tooltip, and filter points with a slider — all declarative.
Widgets
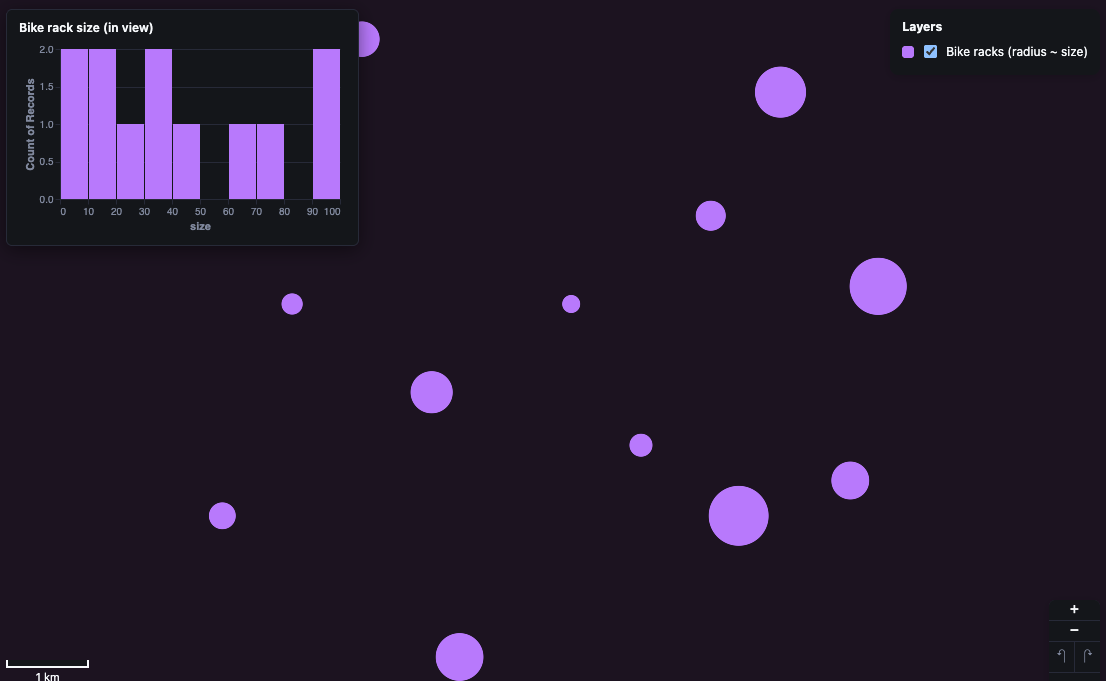
Add widgets
Add a legend, zoom controls, a scale bar and a live Vega-Lite chart without writing any script.
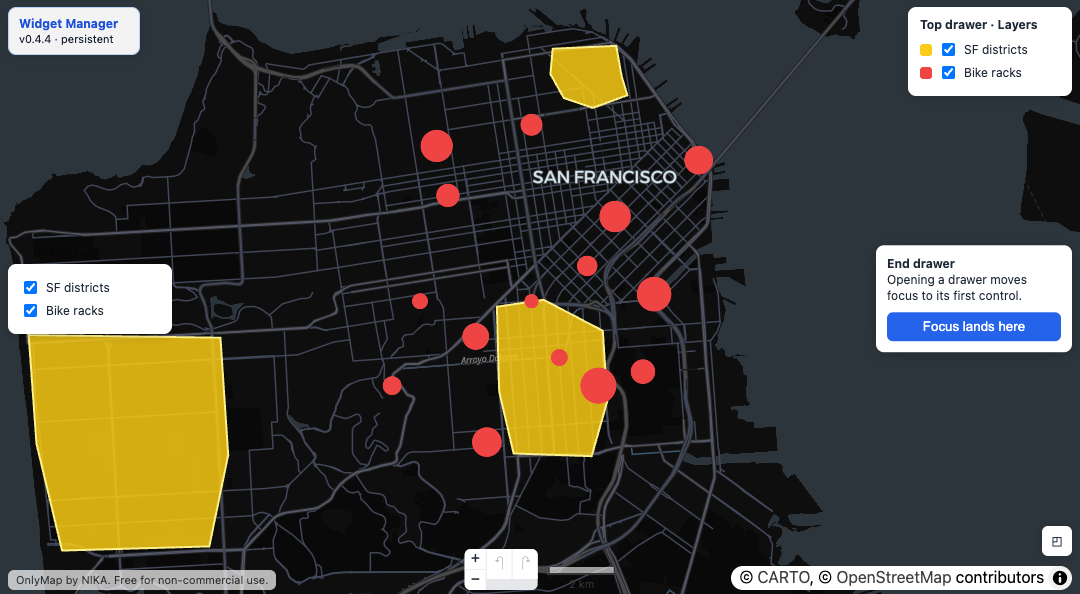
Use the responsive widget manager
Place widgets in eight logical slots that stack, cluster, and fold into drawers on narrow screens.
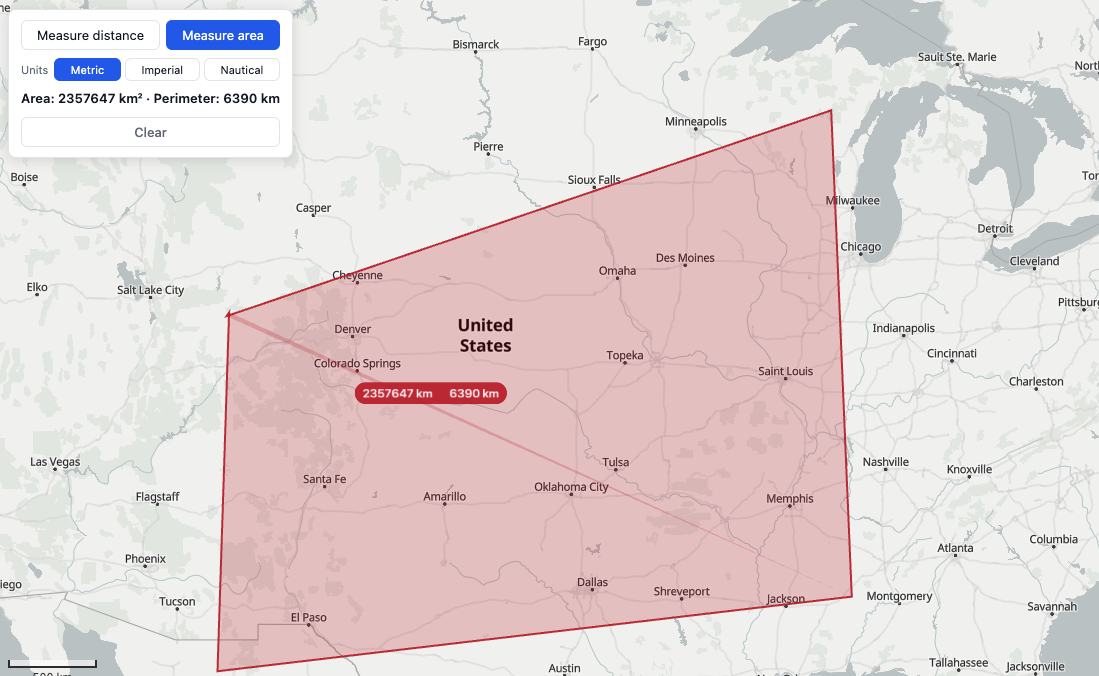
Measure distance and area
Measure geodesic distance and area on the map with the measure widget. Haversine lengths, spherical-excess areas, unit toggle.
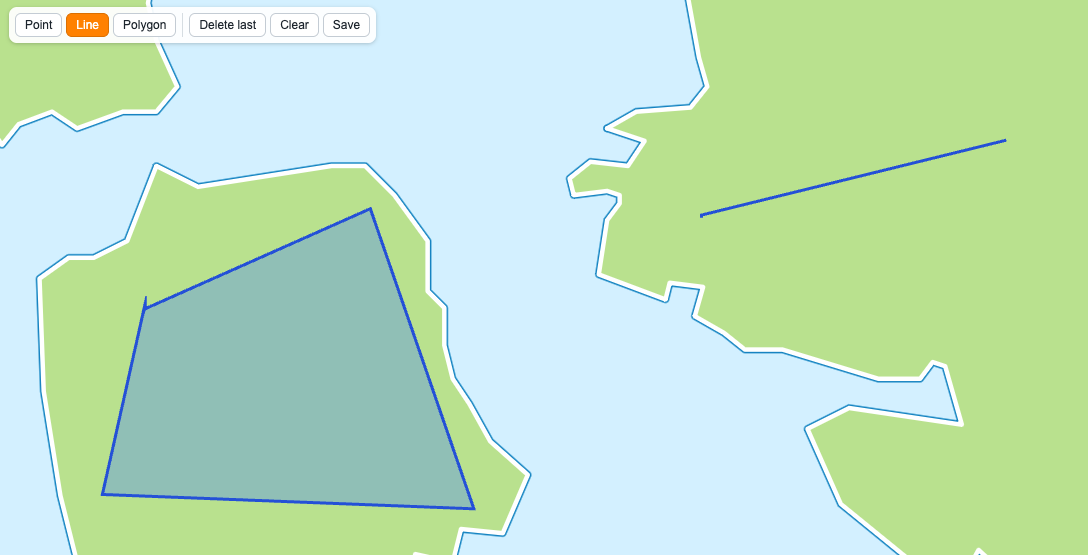
Draw manually
Draw points, lines and polygons on the map, then save them as GeoJSON. Sketches join undo and redo.
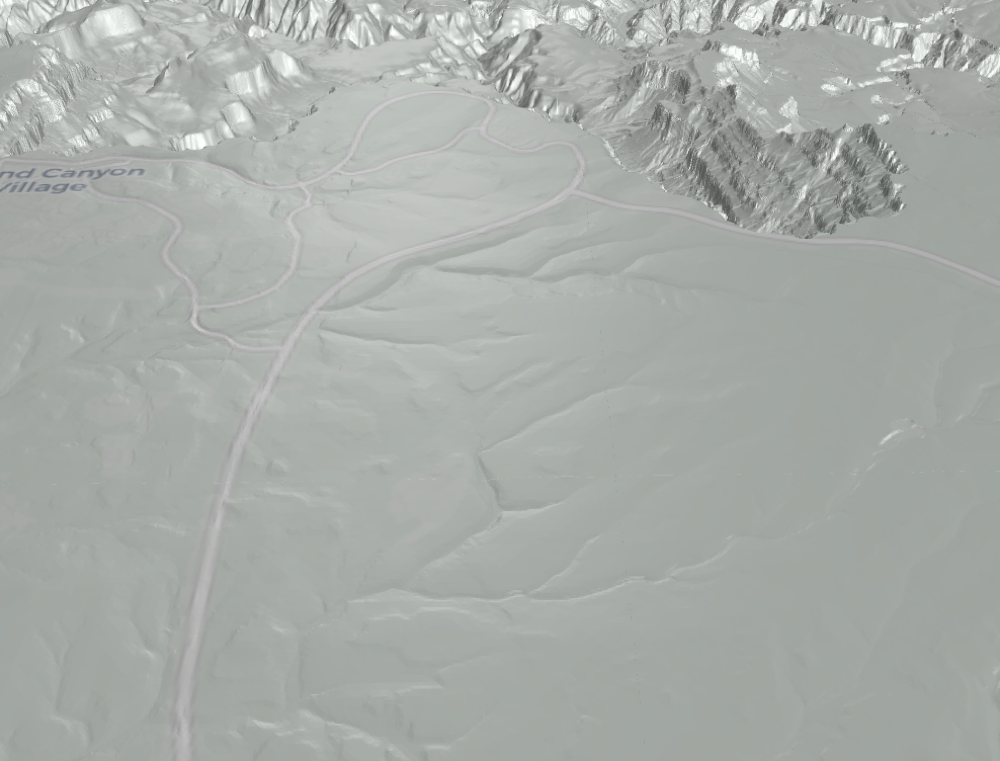
Cut/fill volume + elevation profile
Measure cut and fill volume against real terrain. Per-cell DEM integration with a published error bound, six base surfaces, and a live elevation profile.
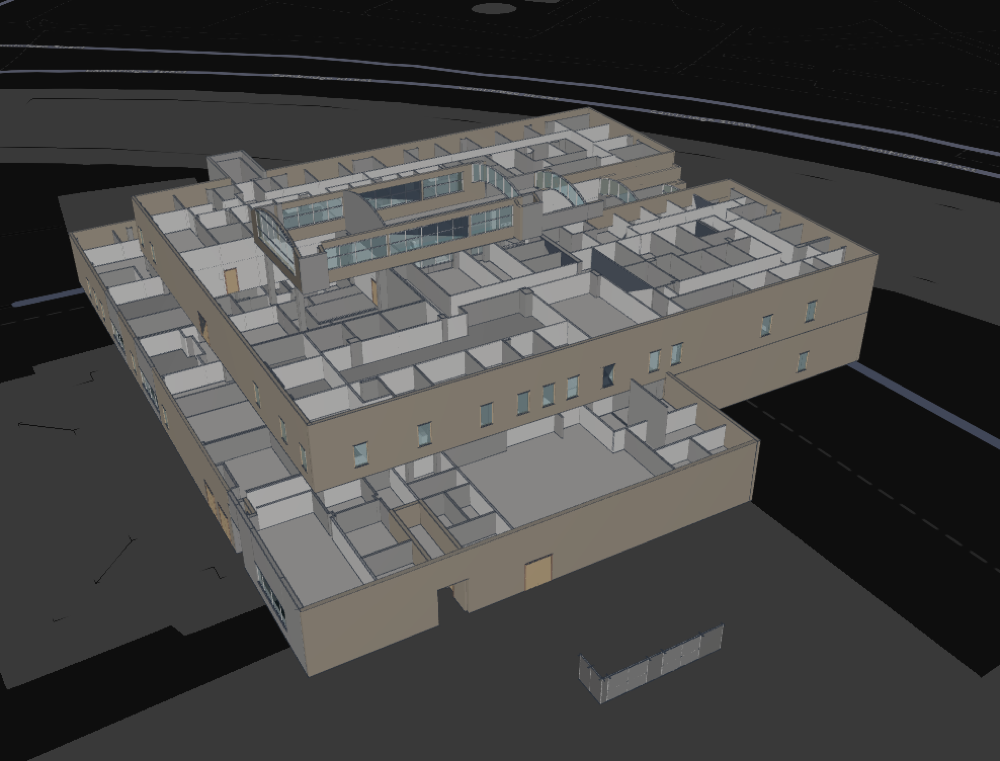
3D snapping & cutting tools
Cut a clip box through a BIM model, export the 3D content inside a drawn footprint as GLB, and snap sketch vertices to real wall corners.
02 — 6 pages
Examples
Complete maps on real data, some of them live. Copy one and swap in your own — the chrome and interaction carry over.
Transport & logistics
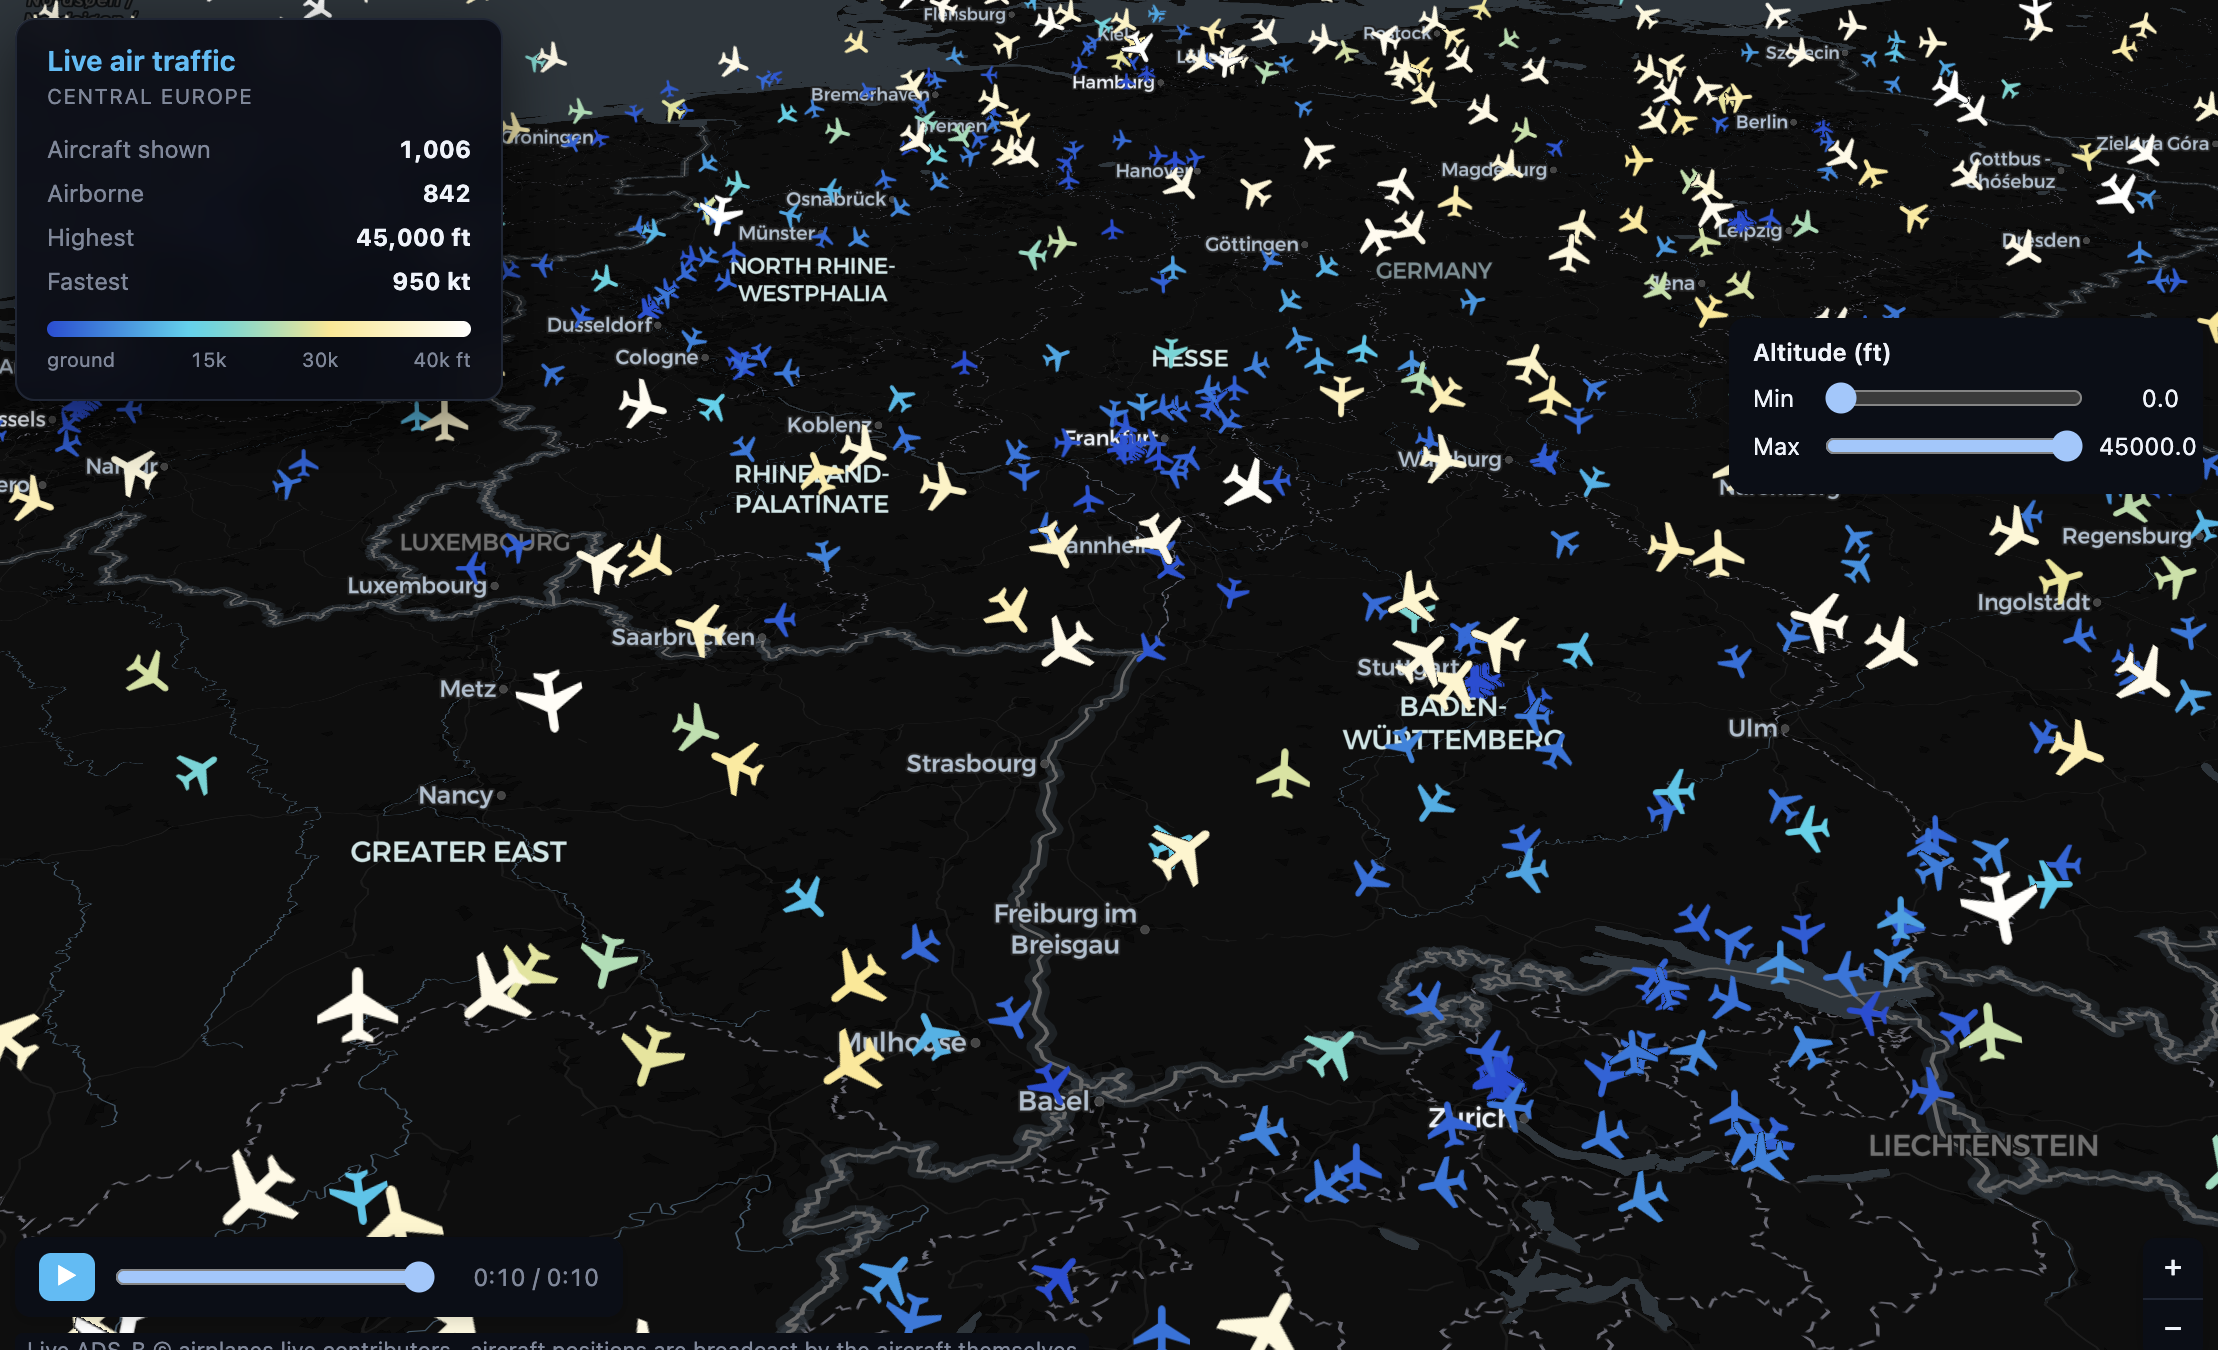
Live European airspace
Track real aircraft over Europe from a live ADS-B websocket. IconLayer with key upserts, flush coalescing and transition tweening.
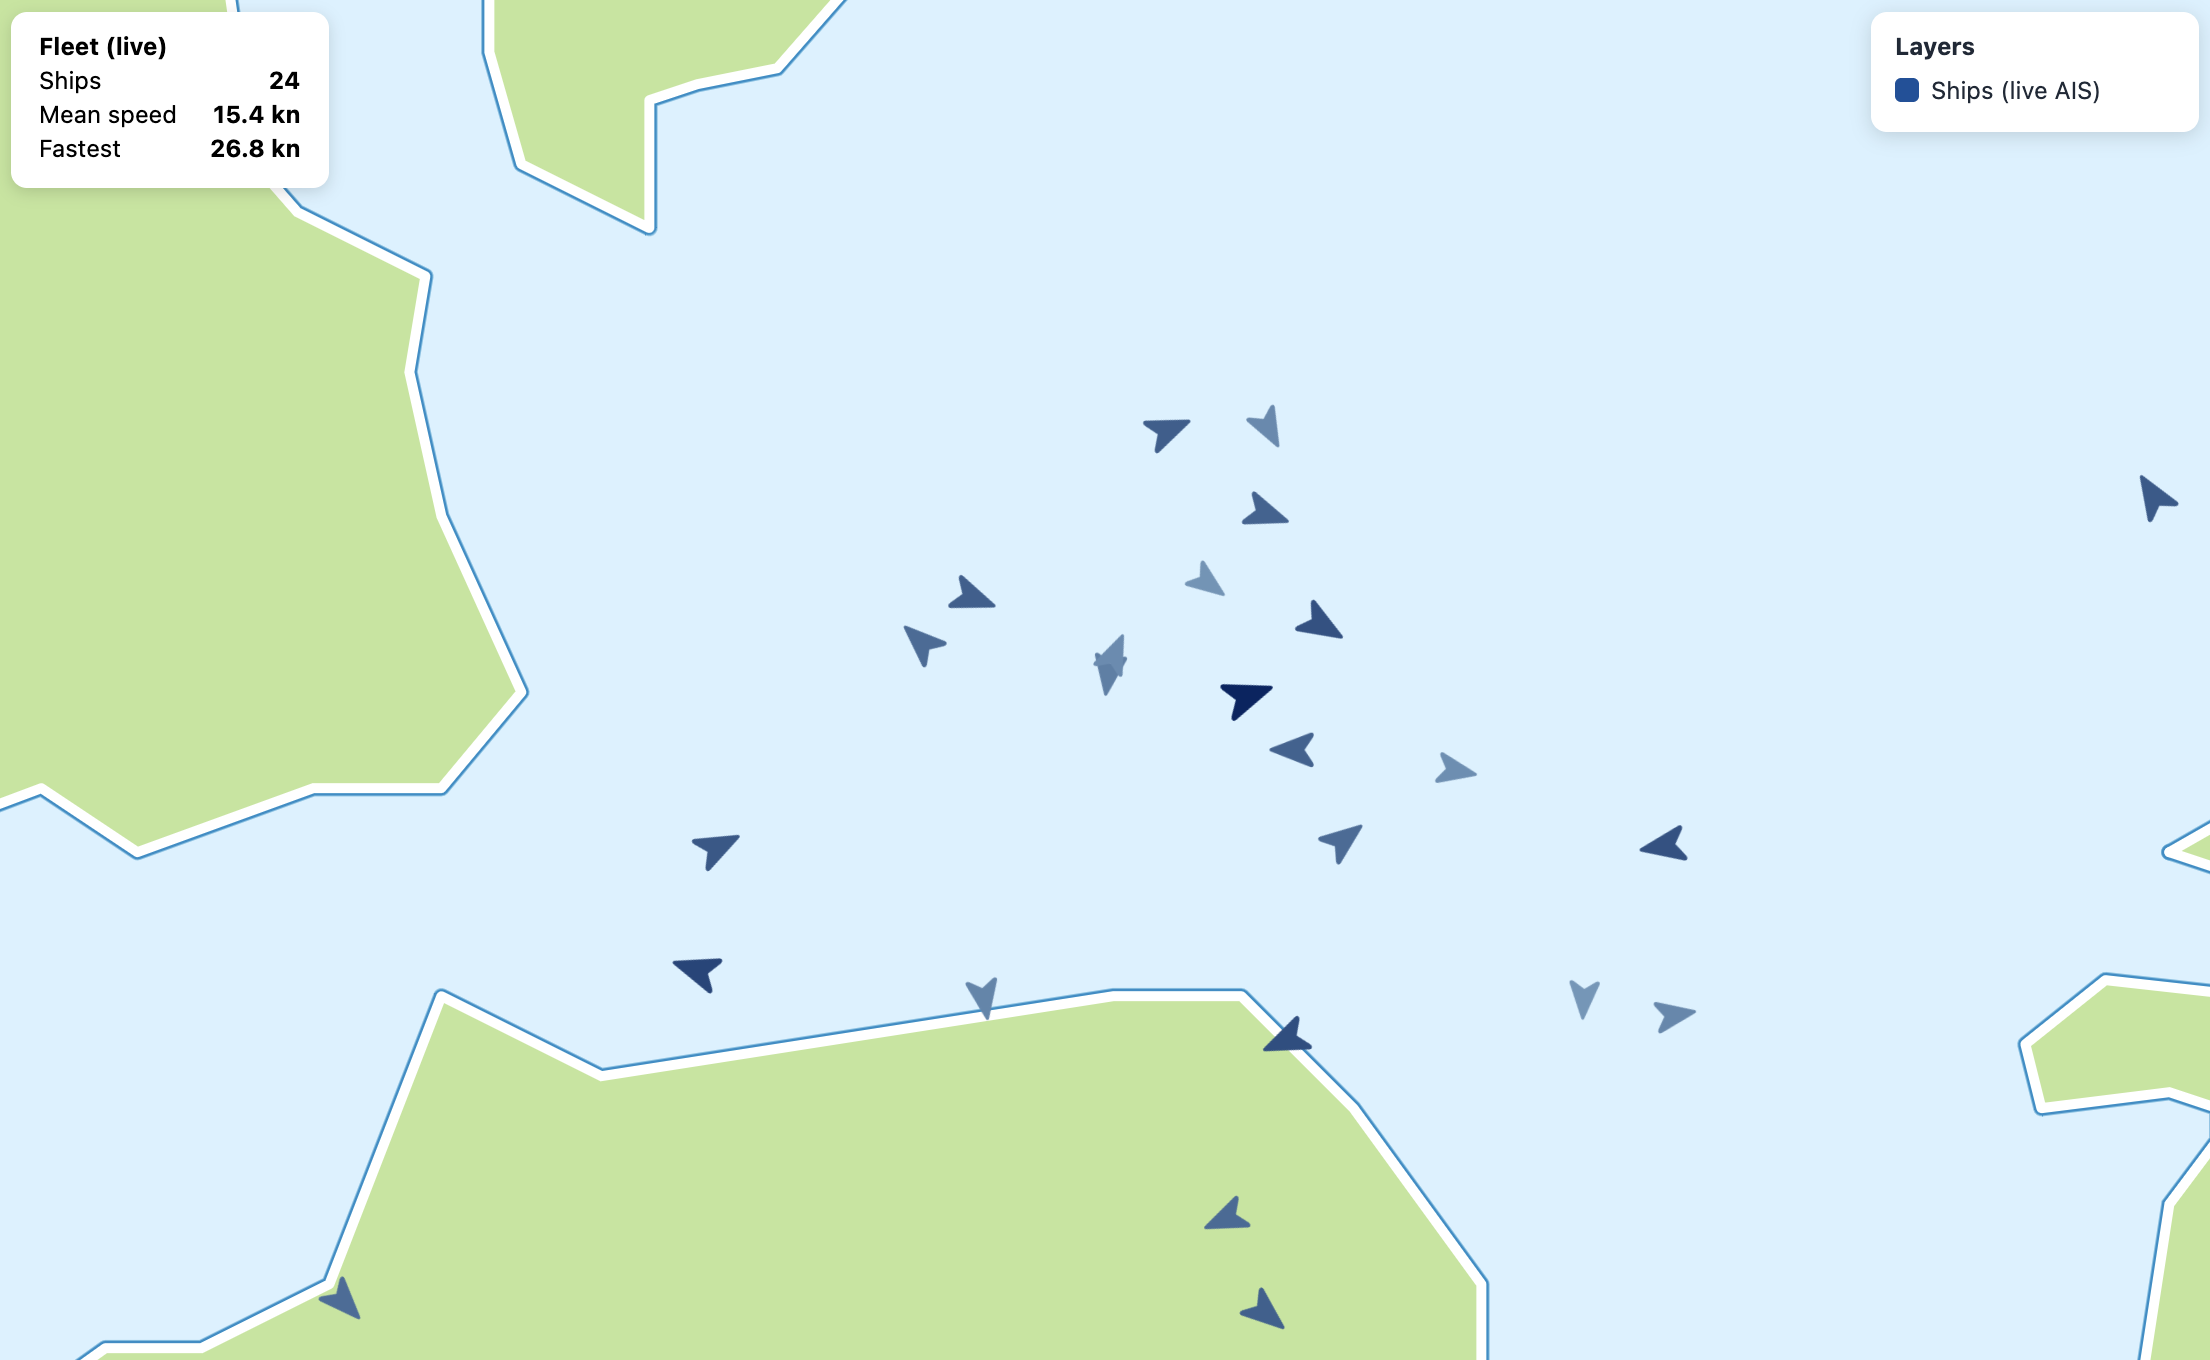
Bay Area shipping
Simulated AIS vessels crossing San Francisco Bay over a websocket. Upsert by key, coalesce bursts with flush, reconnect automatically.
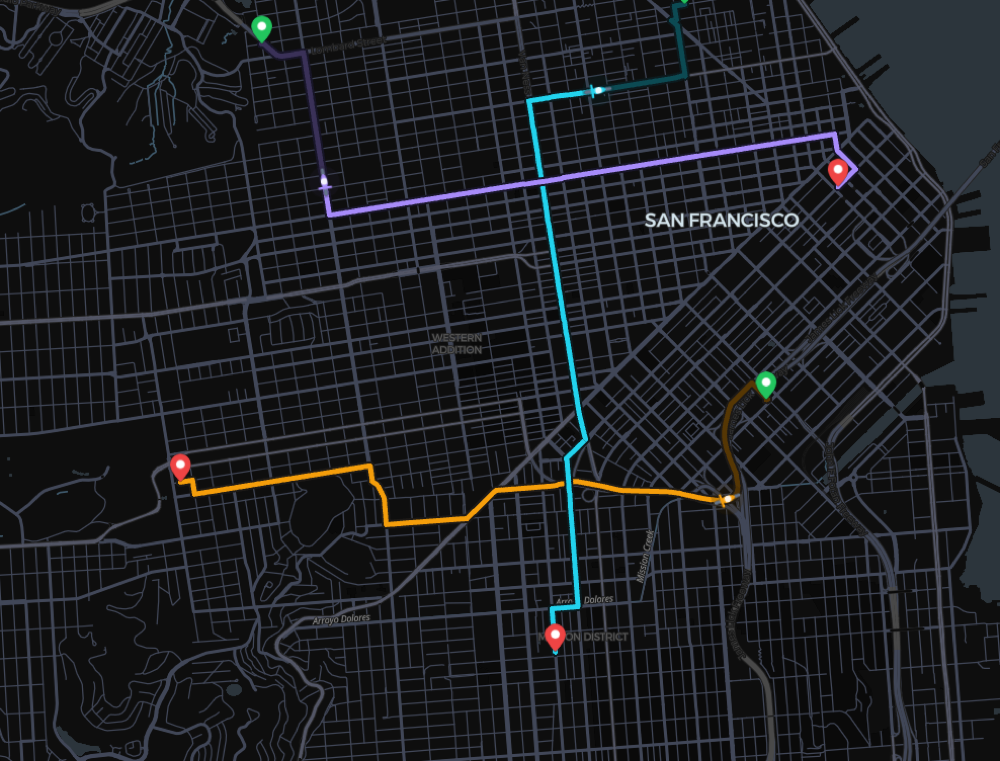
Delivery Riders
Three delivery riders glide along real OSRM street routes at once — one Tracking layer per rider, each interpolating independently, with matching Route layers and live progress bars.
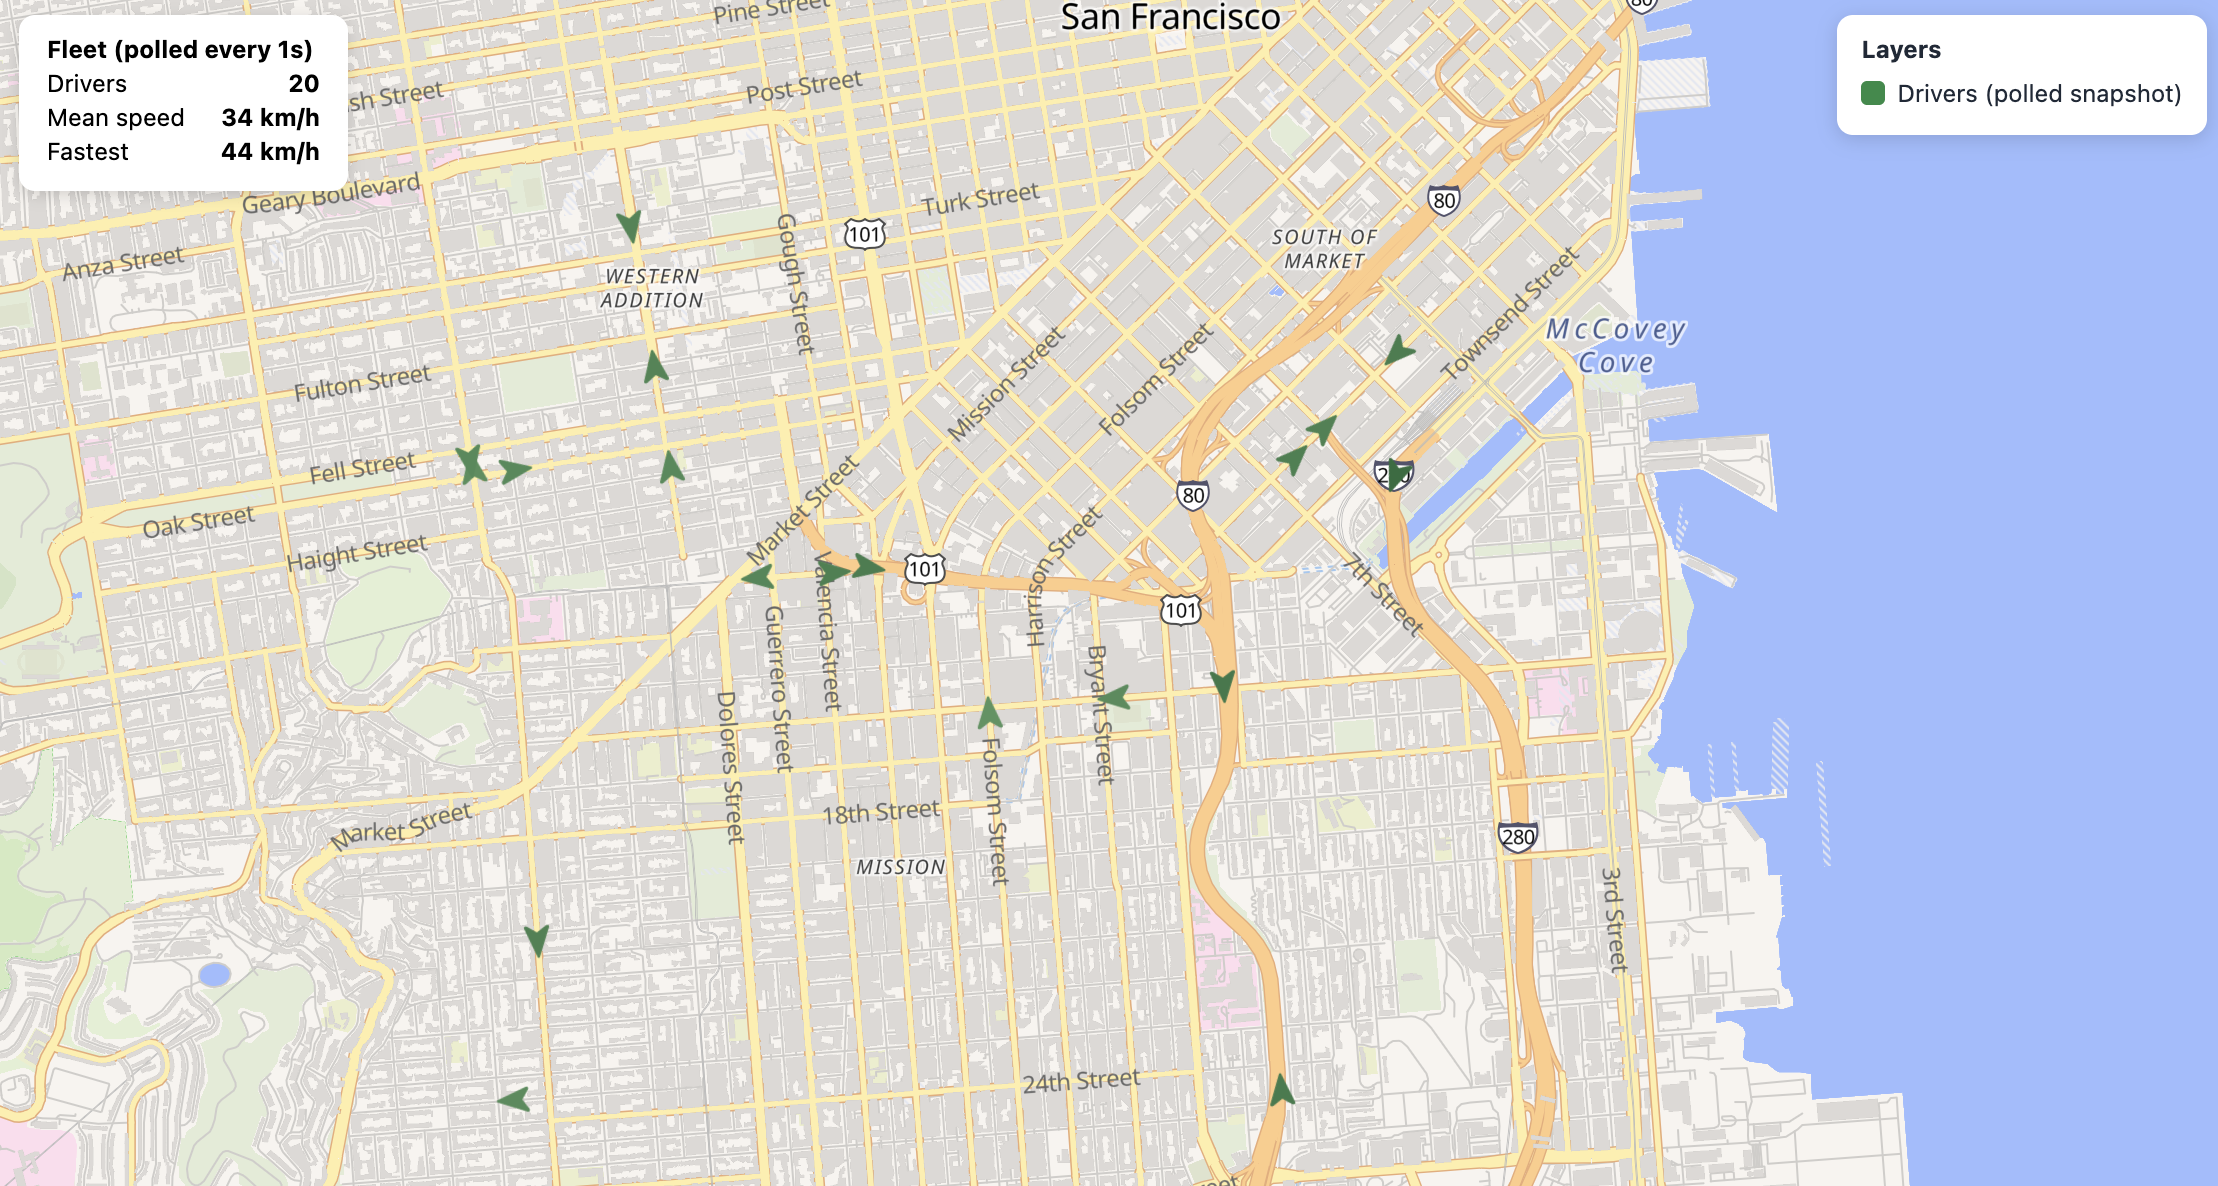
San Francisco last mile
Fleet tracking with polled telematics: vehicle positions refreshed from a REST snapshot, with configureData attaching the bearer token.
Urban planning


Climate & hazards
03 — 1 page
Integrations
Connect OnlyMapJS to the tools you already use.

No example matches that search.